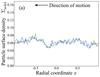
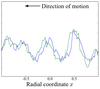
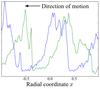
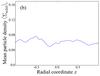
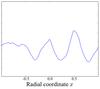
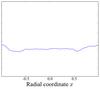
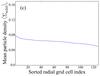
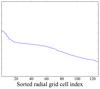
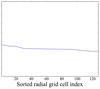
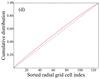
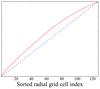
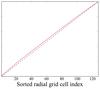
Fig. A.1
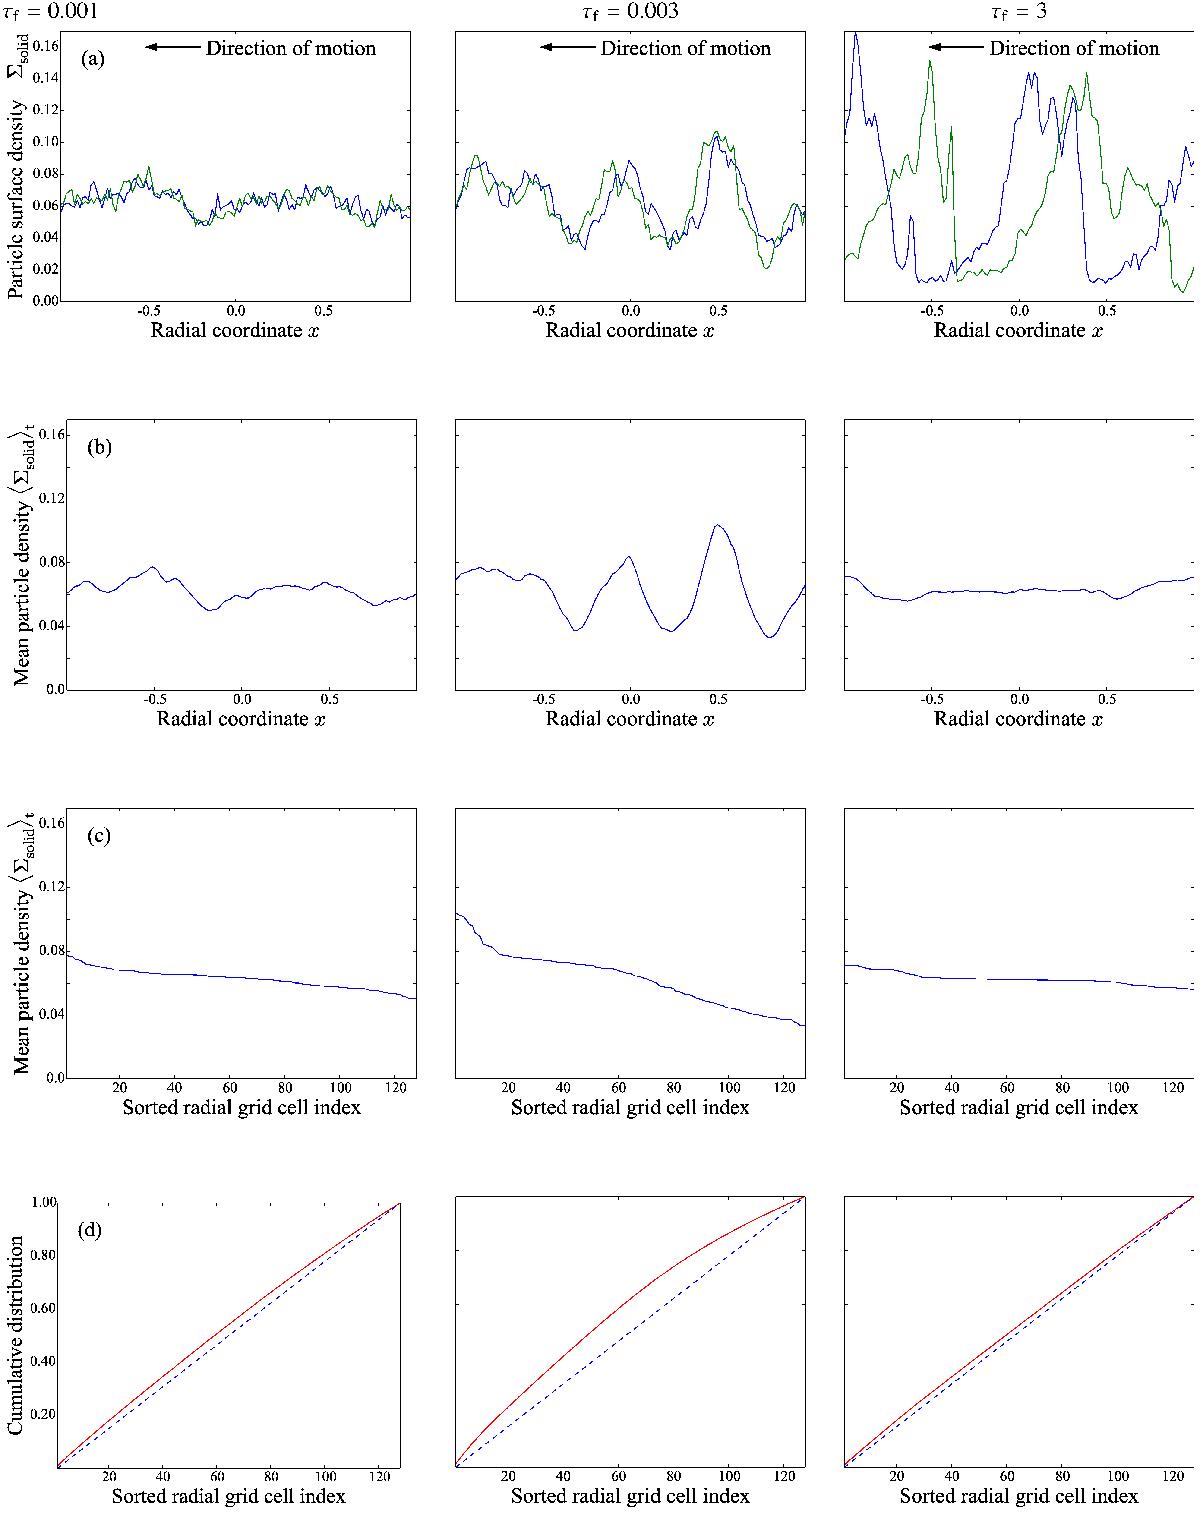
Particle density distribution for three particle sizes. Particle size is measured in the stopping time τf, where τf = 0.001, 0.003 and 3 correspond to the suspension regime, streaming regime and radial drift regime respectively. Row a) is the Surface density of solids Σsolid as a function of the radial coordinate x, evaluated at two points in time 25 orbits apart (first blue, then green). Row b) averages Σsolid over the 25-orbit interval ⟨ Σsolid ⟩ t. Row c) shows ⟨ Σsolid ⟩ t with the grid cells sorted from highest to lowest density. A steep curve indicates stable particle clumps. Row d) shows the cumulative distribution of ⟨ Σsolid ⟩ t in row c) (solid red curve) along with the cumulative distribution of a perfectly uniform particle distribution (dashed blue line). The distance between these two curves serves as a measure of particle clumping. In these plots the particle concentrations Z = ⟨ Σsolid ⟩ / ⟨ Σtotal ⟩ are (left to right) 0.095, 0.095 and 0.05.
Current usage metrics show cumulative count of Article Views (full-text article views including HTML views, PDF and ePub downloads, according to the available data) and Abstracts Views on Vision4Press platform.
Data correspond to usage on the plateform after 2015. The current usage metrics is available 48-96 hours after online publication and is updated daily on week days.
Initial download of the metrics may take a while.