Fig. 13
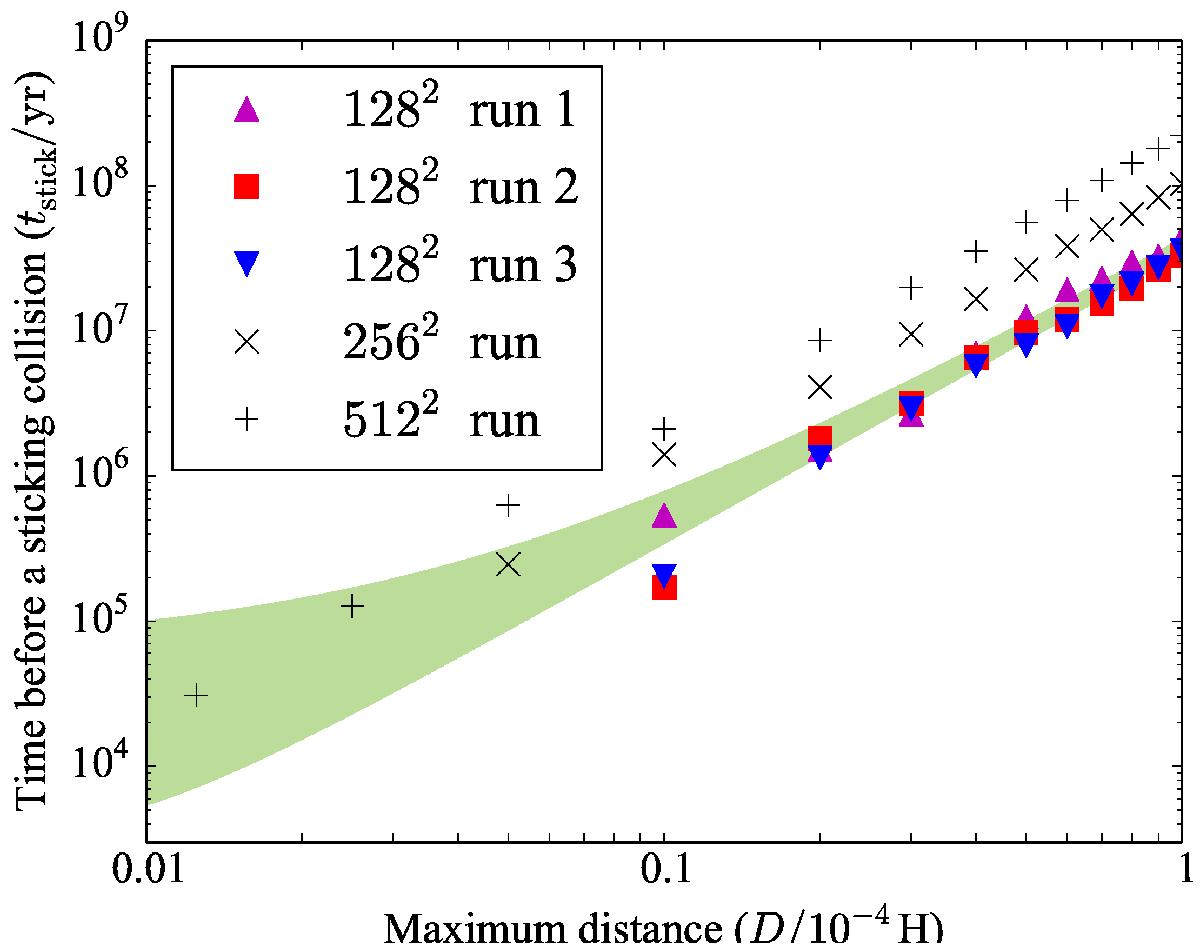
Time between sticking collisions. The figure shows the three 1282 runs from Fig. 11 plus two higher-resolution runs. In all runs the particle size is τf = 0.003 and Z = Σsolid/ Σtotal = 0.074. We fit a Maxwellian distribution to to all particle pairs with separation less than D. Extrapolating the fit toward small D we estimate the time between sticking collisions. The points on the figure appear to follow a power law tstick ∝ D2. The region in green corresponds to the 1σ confidence region marked in Fig. 10. The figure shows that tstick< 105 years is a robust upper bound on tstick.
Current usage metrics show cumulative count of Article Views (full-text article views including HTML views, PDF and ePub downloads, according to the available data) and Abstracts Views on Vision4Press platform.
Data correspond to usage on the plateform after 2015. The current usage metrics is available 48-96 hours after online publication and is updated daily on week days.
Initial download of the metrics may take a while.