Fig. 6
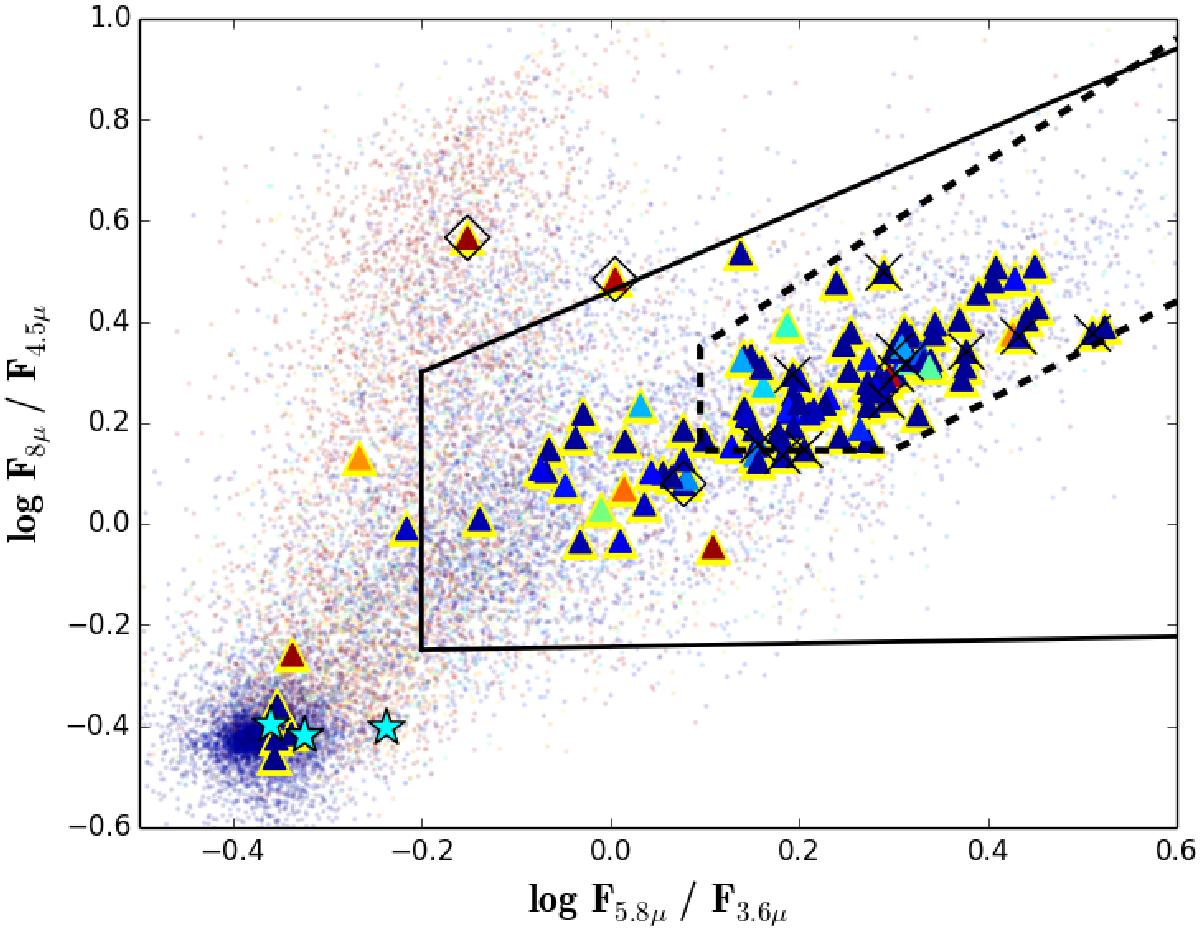
Flux (Fλ) ratio (logarithmic) at 5.8 and 3.6 μ versus flux ratio at 8 and 4.5 μ. Small points: SERVS+SWIRE 18436 sources; triangles (enclosed in yellow edges): 115 sources in common with the selected sample (see Sect. 5.3.2). Cyan stars: stars; diamonds: SN. Crosses: X-ray detected sources. The colours of the triangles and of the small points from red (extended sources) to blue (pointlike sources) indicate the increasing stellarity (as in Fig. 5). The solid line is the Lacy et al. (2004) region and the dashed line the Donley et al. (2012) region.
Current usage metrics show cumulative count of Article Views (full-text article views including HTML views, PDF and ePub downloads, according to the available data) and Abstracts Views on Vision4Press platform.
Data correspond to usage on the plateform after 2015. The current usage metrics is available 48-96 hours after online publication and is updated daily on week days.
Initial download of the metrics may take a while.