Fig. 5
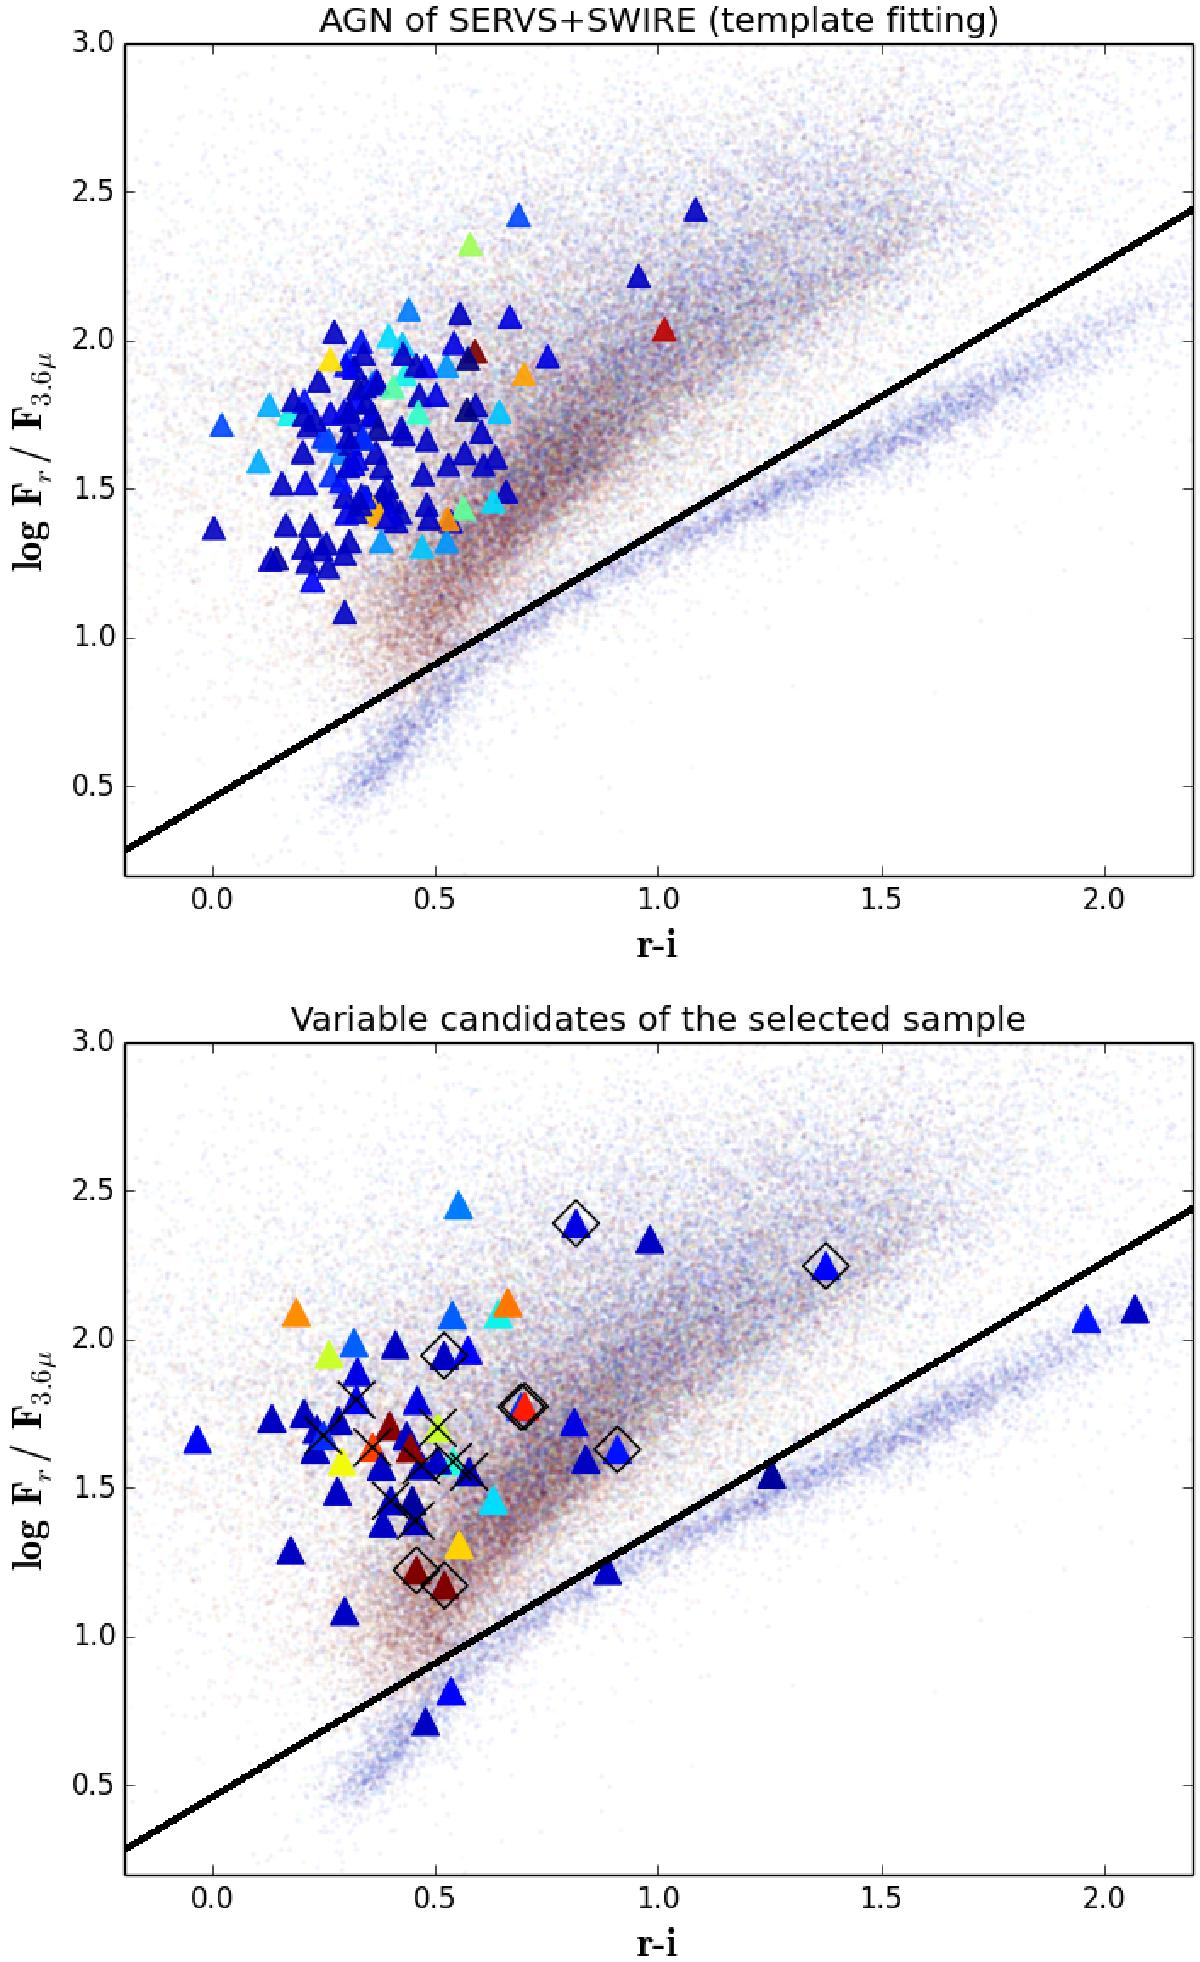
Flux (Fλ) ratios between the r band and 3.6 μm versus r−i colour. In the top panel, the triangles represent sources flagged as AGN in the SERVS+SWIRE catalog, on the basis of optical/IR template fitting (133 AGN, see Sect. 5.3.1). In the bottom panel the triangles represent the 57 sources belonging to our “selected sample” with available i,r, and 3.6 μm photometry in the SERVS+SWIRE catalogues (see Sect. 5.3.1). Diamonds and crosses label the SN and X-ray detected sources, respectively (see Sect. 5.2). In both panels, the small points represent the whole SERVS+SWIRE control sample with available r,i, 3.6 μm photometry (82254 sources). The colours from red (extended sources) to blue (pointlike sources) indicate the increasing stellarity (defined in footnote 9) as measured from the VST images for our “selected sample” or extracted from the SERVS+SWIRE catalogues in the optical r band for the control sample. The solid line divides the plane into the stellar region and the non-stellar region.
Current usage metrics show cumulative count of Article Views (full-text article views including HTML views, PDF and ePub downloads, according to the available data) and Abstracts Views on Vision4Press platform.
Data correspond to usage on the plateform after 2015. The current usage metrics is available 48-96 hours after online publication and is updated daily on week days.
Initial download of the metrics may take a while.