Free Access
Fig. 3
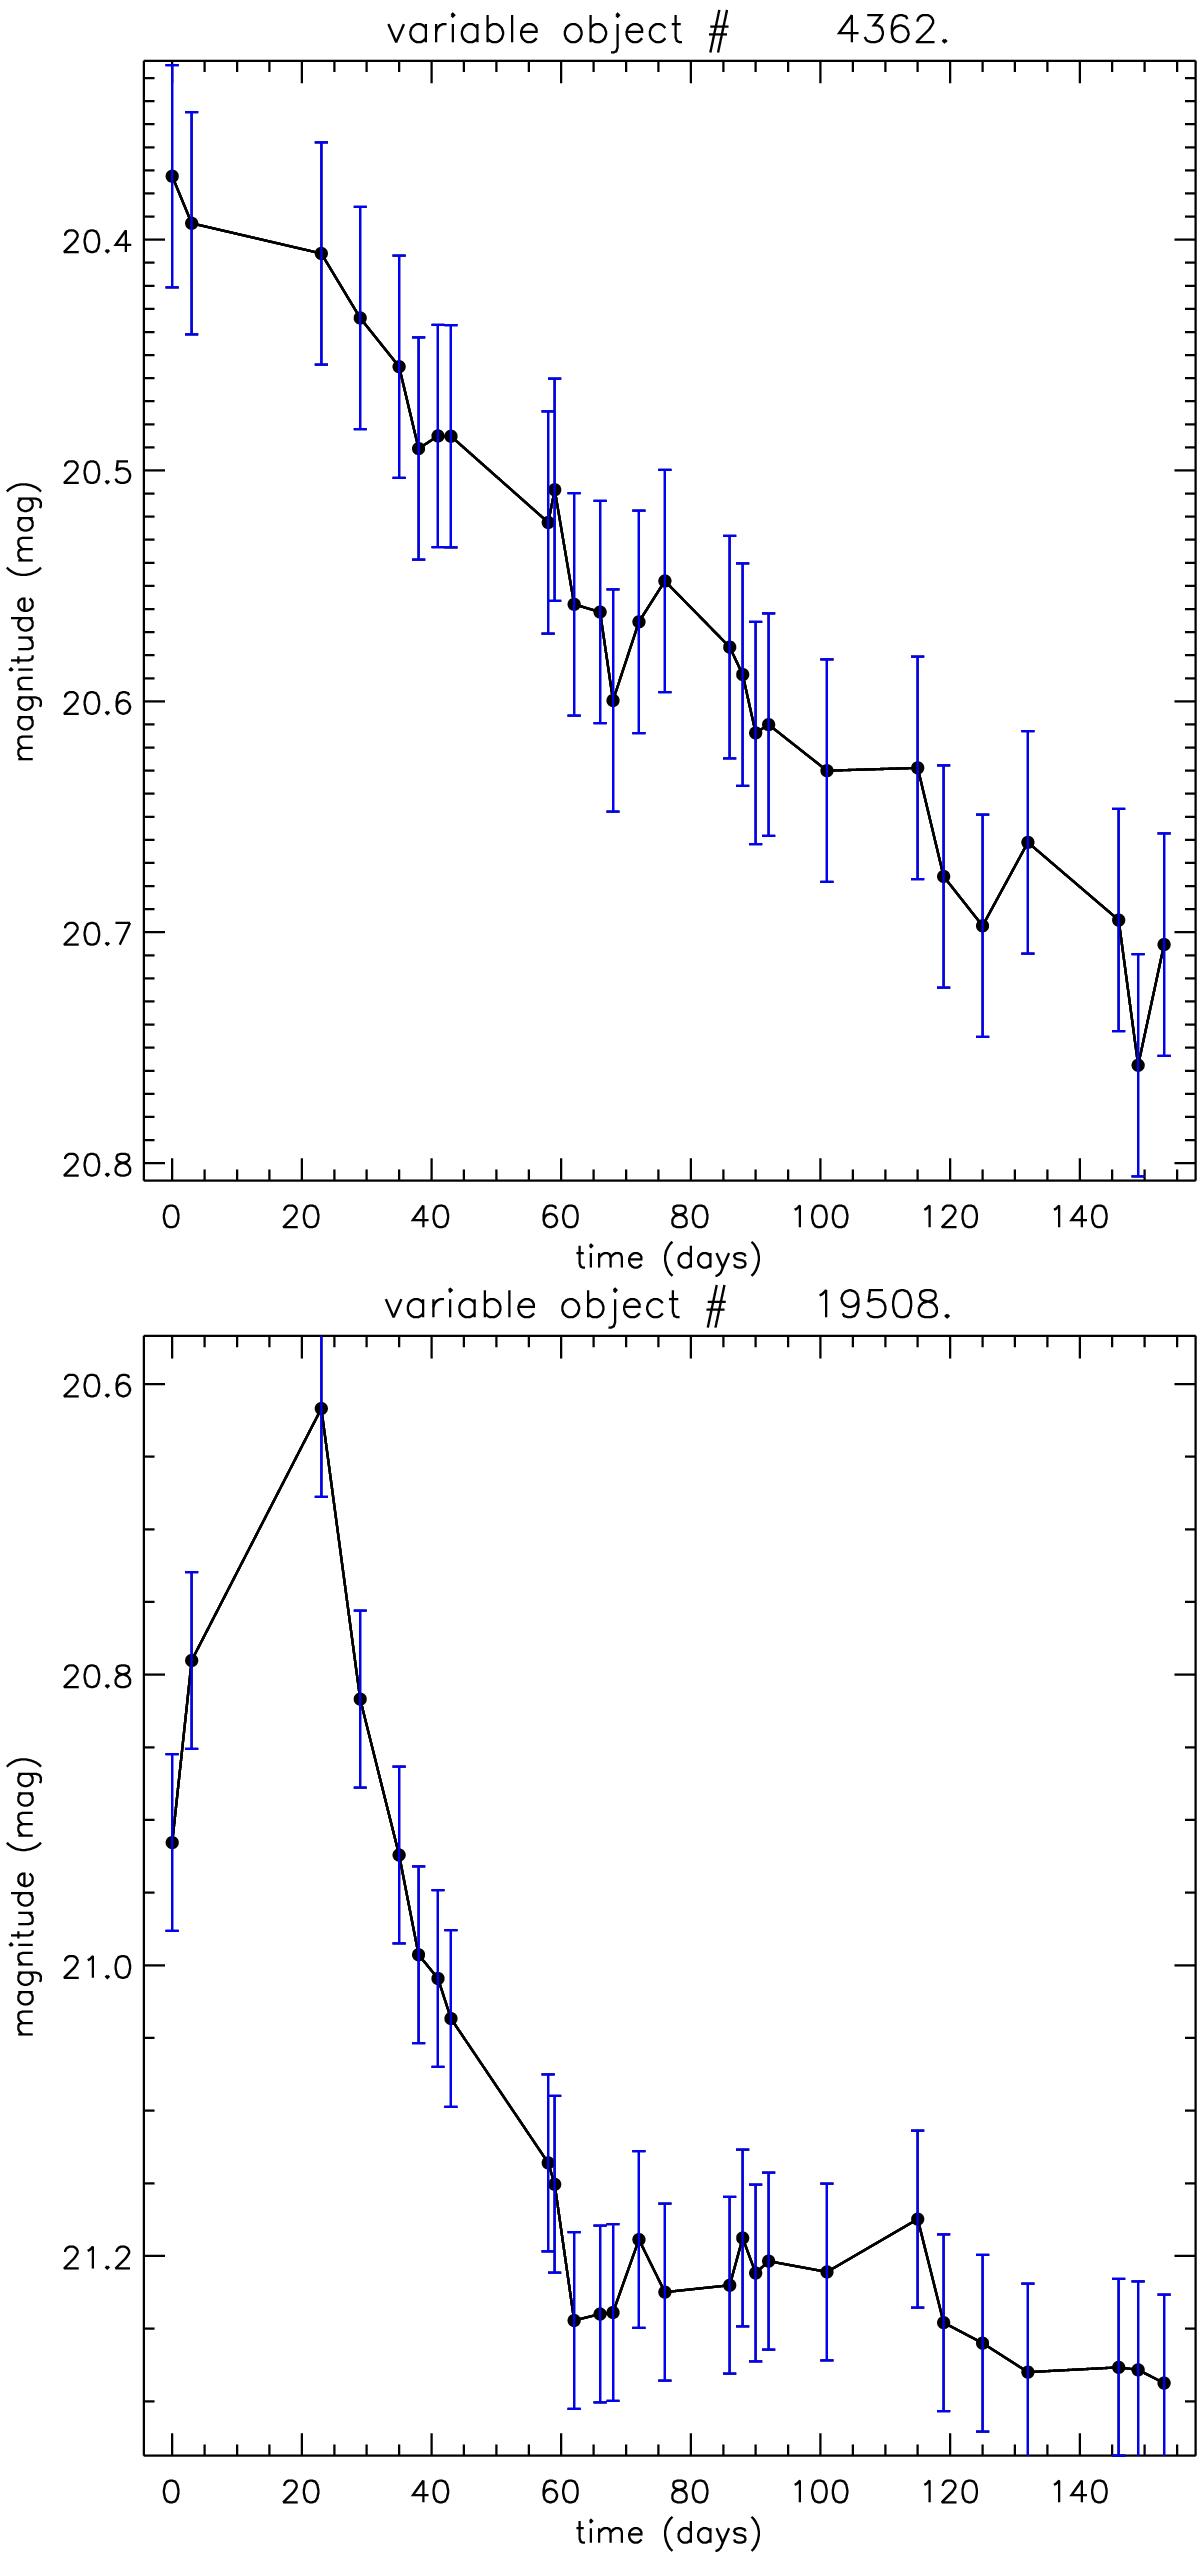
Top panel: lightcurve of an AGN candidate (ID 4362). Bottom panel: lightcurve of a supernova (ID 19508). The error bars do not represent the formal photometric error except the ⟨ σ ⟩ + 3 × rms⟨ σ ⟩ variability limit and are shown to allow the reader to visualise the significance of the variability.
This figure is made of several images, please see below:
Current usage metrics show cumulative count of Article Views (full-text article views including HTML views, PDF and ePub downloads, according to the available data) and Abstracts Views on Vision4Press platform.
Data correspond to usage on the plateform after 2015. The current usage metrics is available 48-96 hours after online publication and is updated daily on week days.
Initial download of the metrics may take a while.