Free Access
Fig. 1
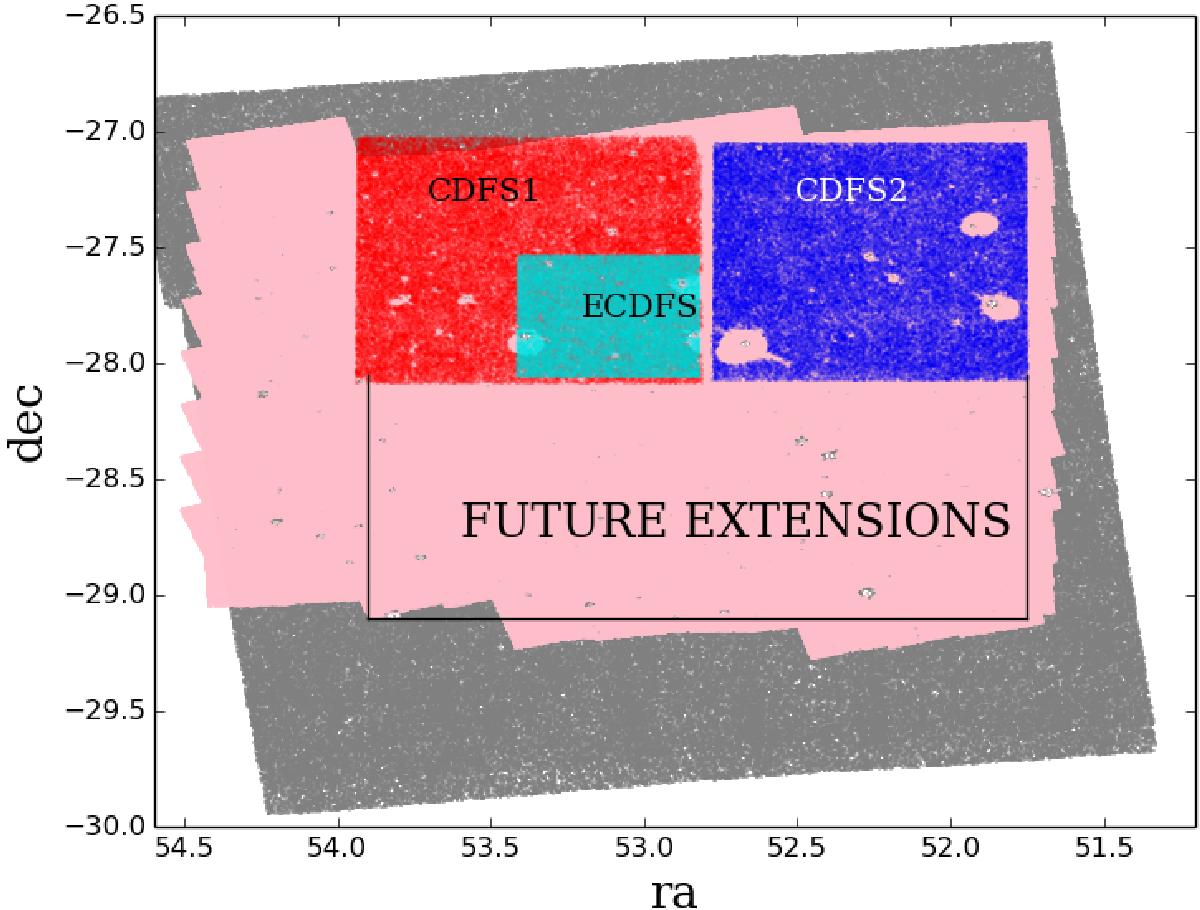
Region covered by the VST observations compared to other overlapping surveys. Red: VST-CDFS1, blue: VST-CDFS2, grey: SWIRE, pink: SERVS, cyan: ECDFS area. The holes in the CDFS1 and CDFS2 are due to the masks we applied to exclude bright stars, spikes, and reflection features, as explained in detail in Sect. 3.
Current usage metrics show cumulative count of Article Views (full-text article views including HTML views, PDF and ePub downloads, according to the available data) and Abstracts Views on Vision4Press platform.
Data correspond to usage on the plateform after 2015. The current usage metrics is available 48-96 hours after online publication and is updated daily on week days.
Initial download of the metrics may take a while.