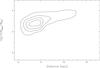
Fig. 8
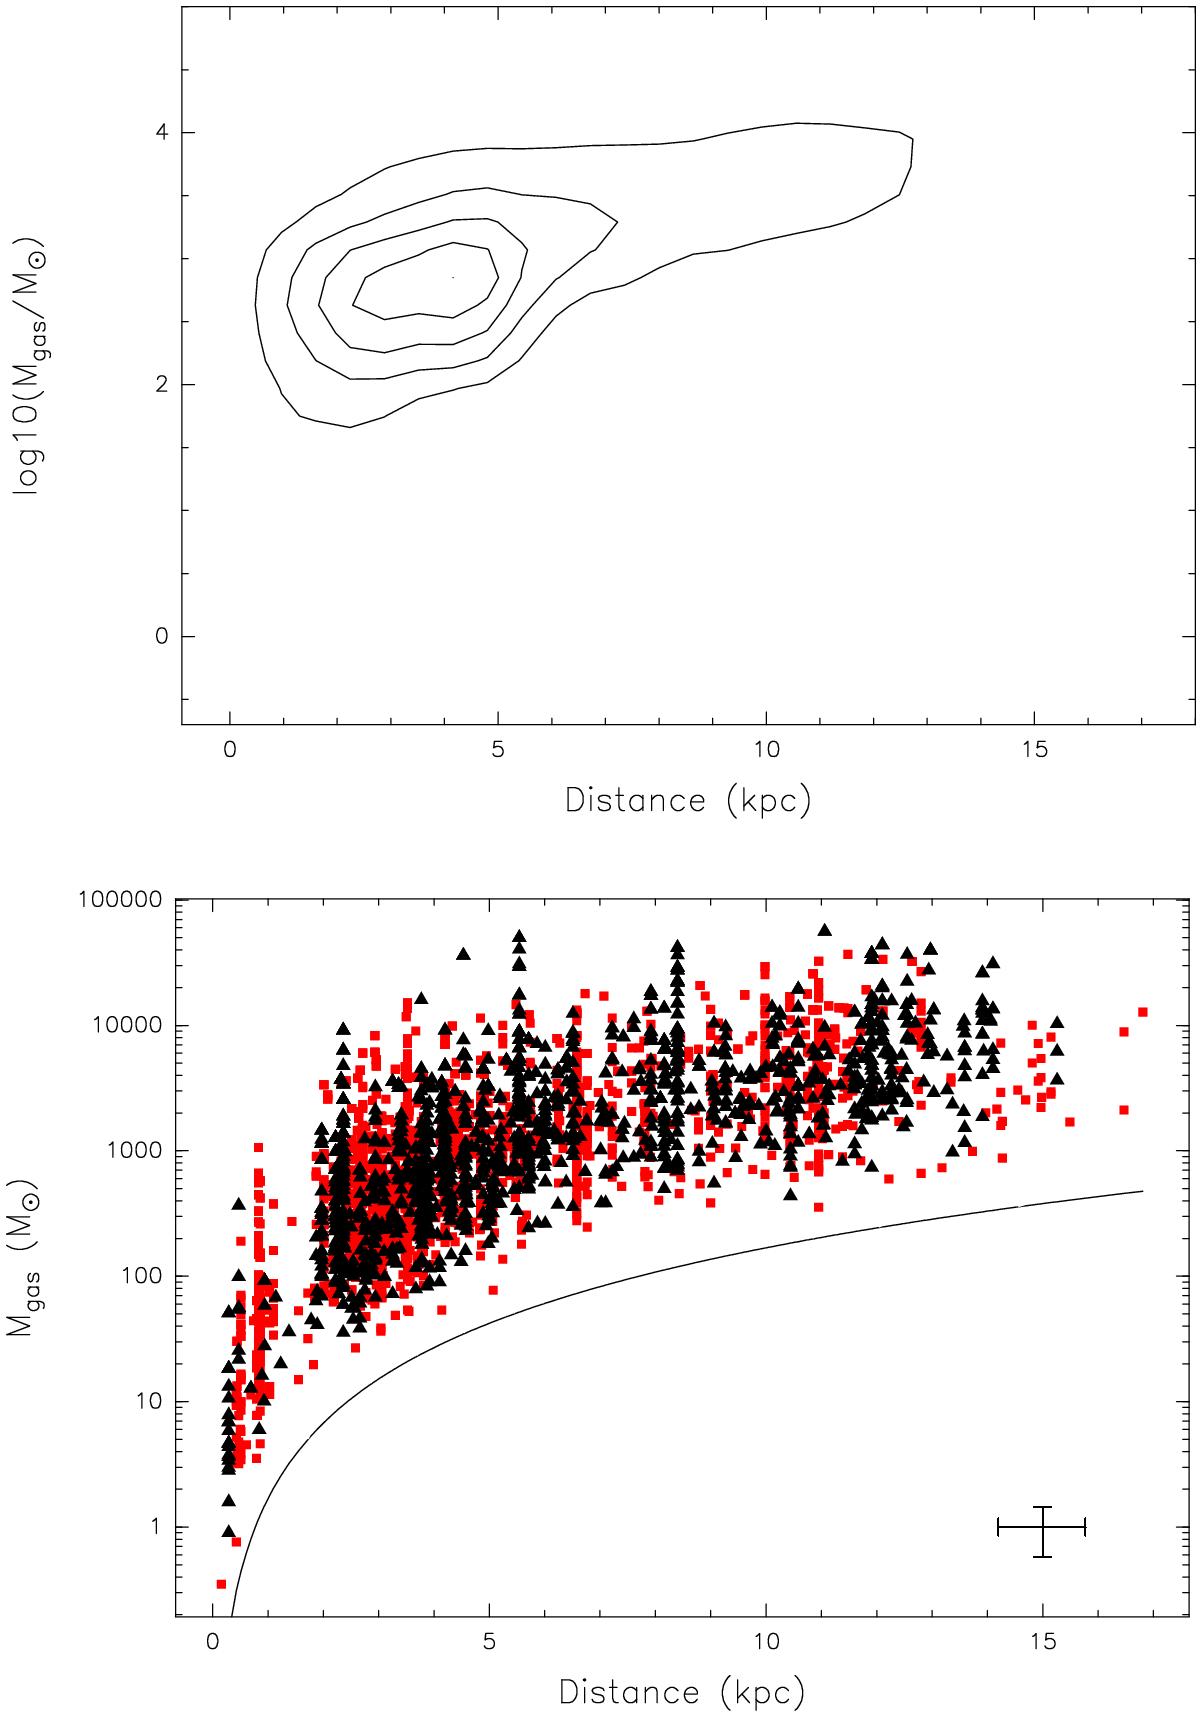
Correlation plot of the kinematic distances and gas masses for the ATLASGAL sources in the first quadrant as black triangles and the clumps in the fourth quadrant as red points. The curve shows a minimum 5σ detection. The upper panel illustrates the contour plot, for which we counted the number of sources in each kinematic distance bin of 2 kpc and each logarithmic gas mass bin of 0.25. The contours give 10 to 90% in steps of 20% of the peak source number per bin. The error bar displays the average distance and mass errors.
Current usage metrics show cumulative count of Article Views (full-text article views including HTML views, PDF and ePub downloads, according to the available data) and Abstracts Views on Vision4Press platform.
Data correspond to usage on the plateform after 2015. The current usage metrics is available 48-96 hours after online publication and is updated daily on week days.
Initial download of the metrics may take a while.