Fig. 4
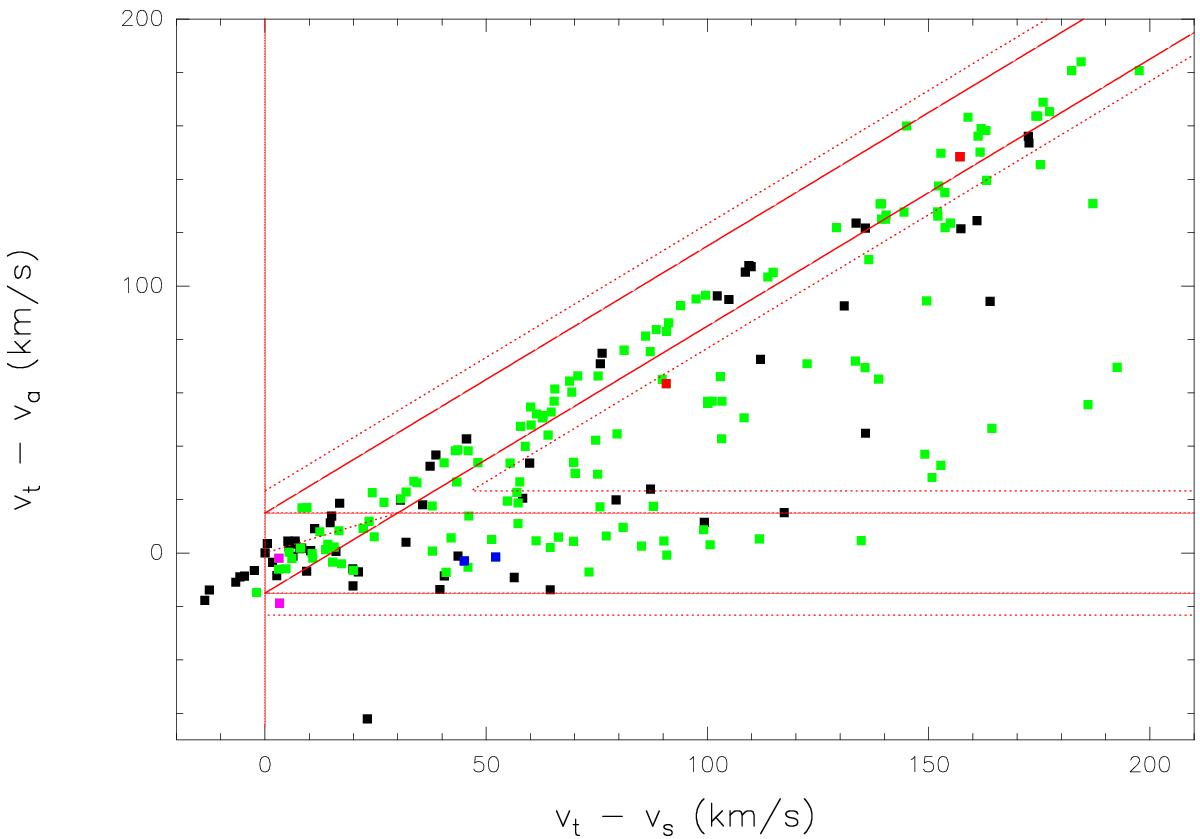
Comparison of the differences between the tangent point velocity (vt), the maximum velocity of absorption lines in the 21 cm continuum (va), and the source velocity (vs) of HII regions. The subsample in the first quadrant is shown in black and sources in the fourth quadrant in green. To be able to display the two in one plot, we invert the velocity differences of HII regions in the fourth quadrant. The solid and dotted lines confine regions, where 21 cm continuum sources are assigned near and far distances using the method from Kolpak et al. (2003). The examples of ATLASGAL sources shown in Fig. 3 are indicated: clumps at the near distance are shown in red, sources at the far distance in blue, and clumps at the tangent point in purple.
Current usage metrics show cumulative count of Article Views (full-text article views including HTML views, PDF and ePub downloads, according to the available data) and Abstracts Views on Vision4Press platform.
Data correspond to usage on the plateform after 2015. The current usage metrics is available 48-96 hours after online publication and is updated daily on week days.
Initial download of the metrics may take a while.