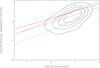
Fig. A.4
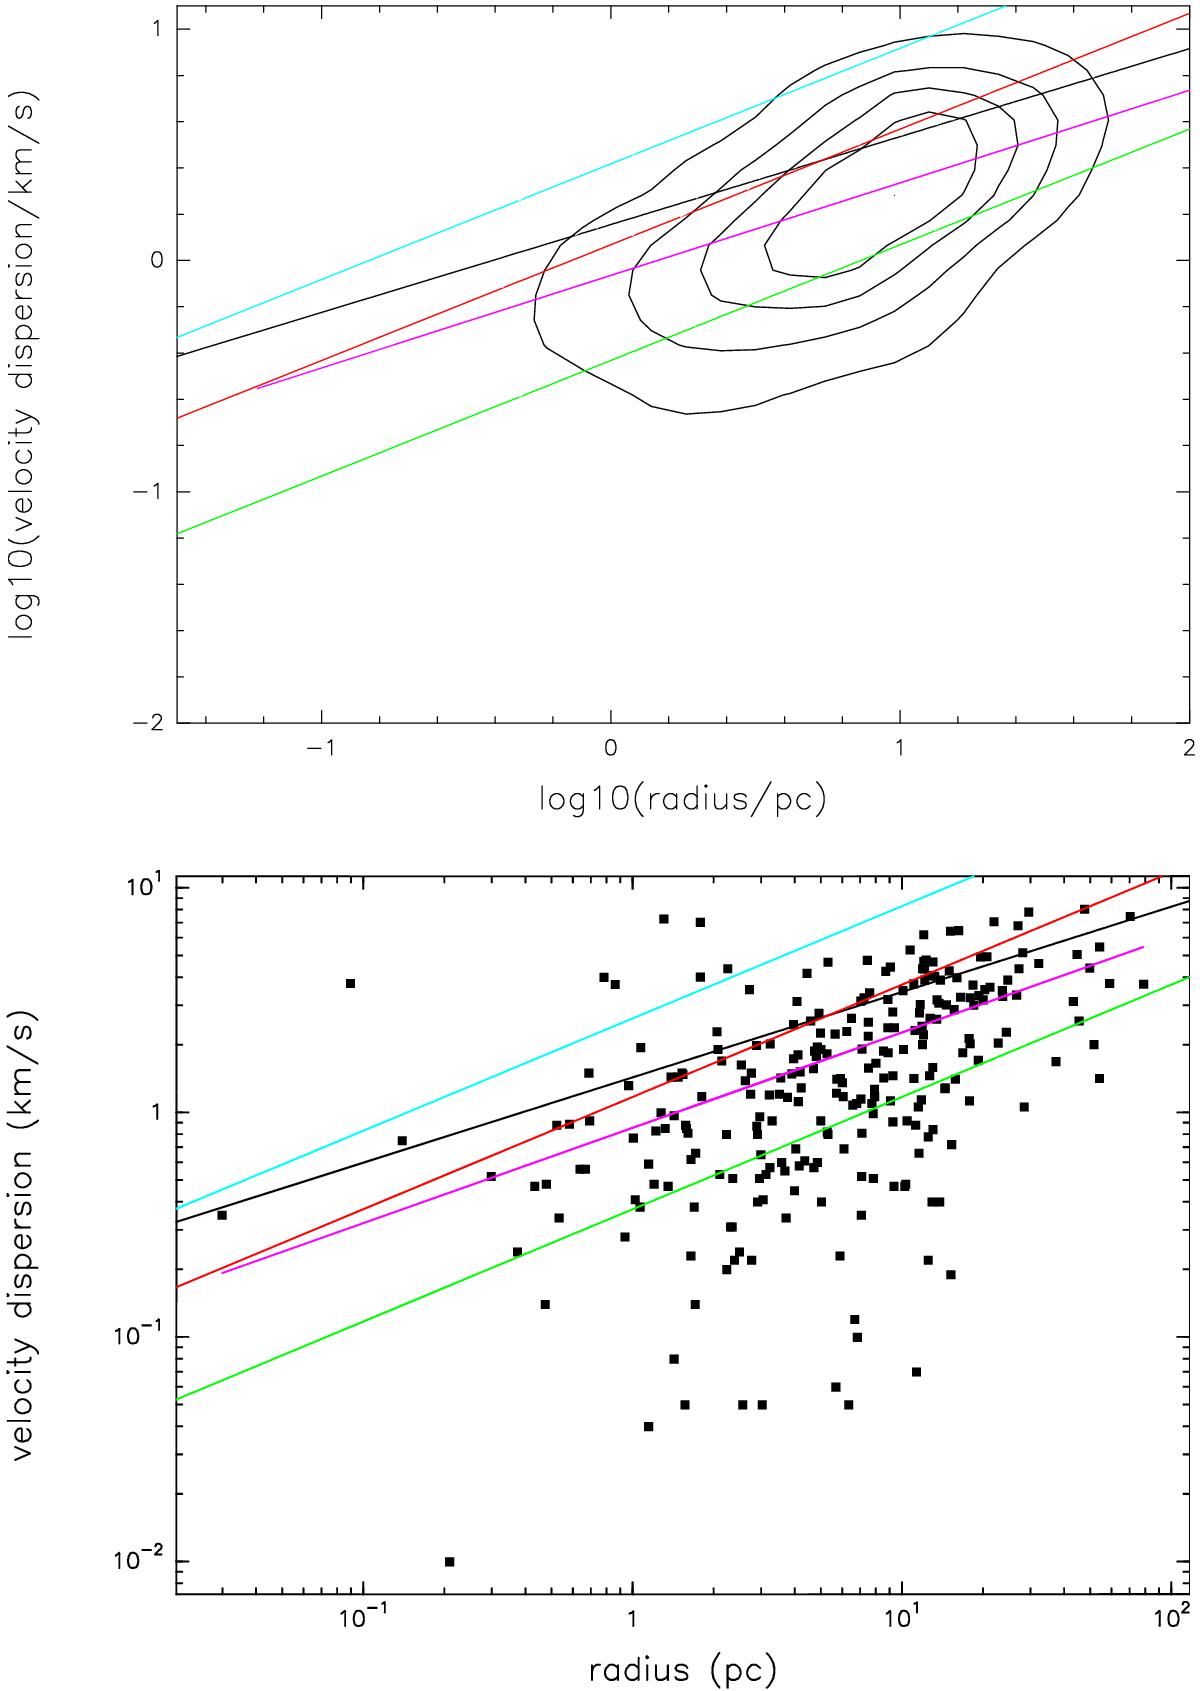
Correlation plot of the radius and velocity dispersion of all groups. The black line indicates the relation by Larson (1981), the green, red, and blue lines show the formula by Ballesteros-Paredes et al. (2011) for an H2 column density of 1021 cm-2, 1022 cm-2, and 5 × 1022 cm-2. The purple line shows a power-law fit to the data with an exponent of 0.4 ± 0.02. The contour plot is shown in the upper panel with the range of the logarithm of the radius and the velocity dispersion divided into bins of 0.3.
Current usage metrics show cumulative count of Article Views (full-text article views including HTML views, PDF and ePub downloads, according to the available data) and Abstracts Views on Vision4Press platform.
Data correspond to usage on the plateform after 2015. The current usage metrics is available 48-96 hours after online publication and is updated daily on week days.
Initial download of the metrics may take a while.