Fig. A.2
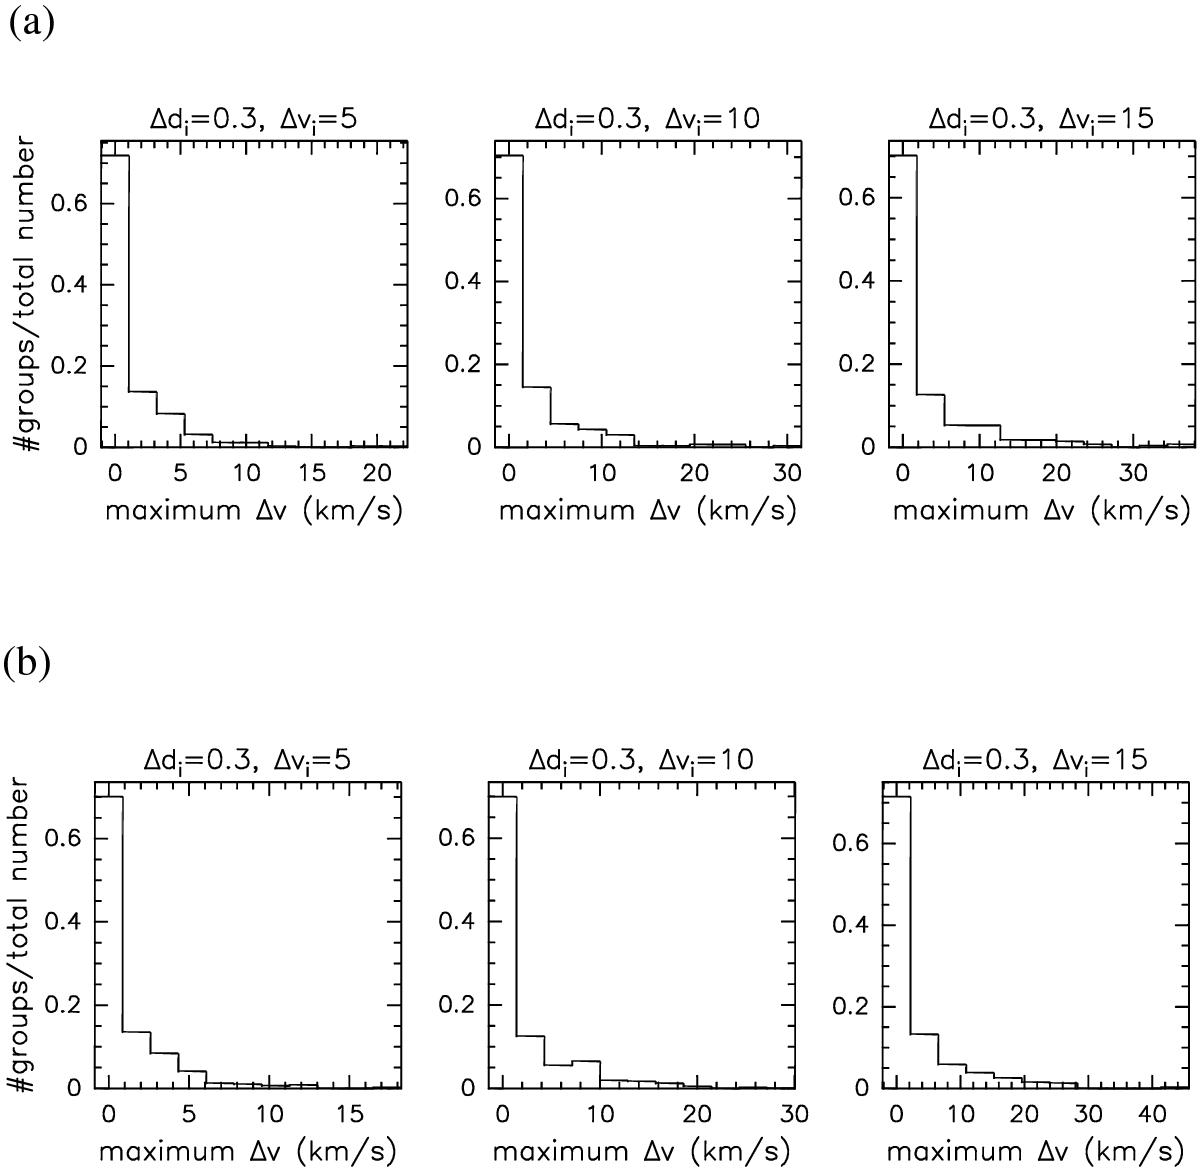
Relative number distribution of ATLASGAL groups in the first quadrant in panel a) and groups in the fourth quadrant in panel b) with the maximum velocity difference in a group for different input values of the velocity interval to search for associated sources in a group, Δvi. We use 5 to 15 km s-1 for that and a fixed maximum distance between individual sources in a group, Δdi, of 0.3°.
Current usage metrics show cumulative count of Article Views (full-text article views including HTML views, PDF and ePub downloads, according to the available data) and Abstracts Views on Vision4Press platform.
Data correspond to usage on the plateform after 2015. The current usage metrics is available 48-96 hours after online publication and is updated daily on week days.
Initial download of the metrics may take a while.