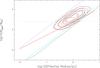
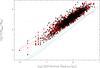
Fig. 24
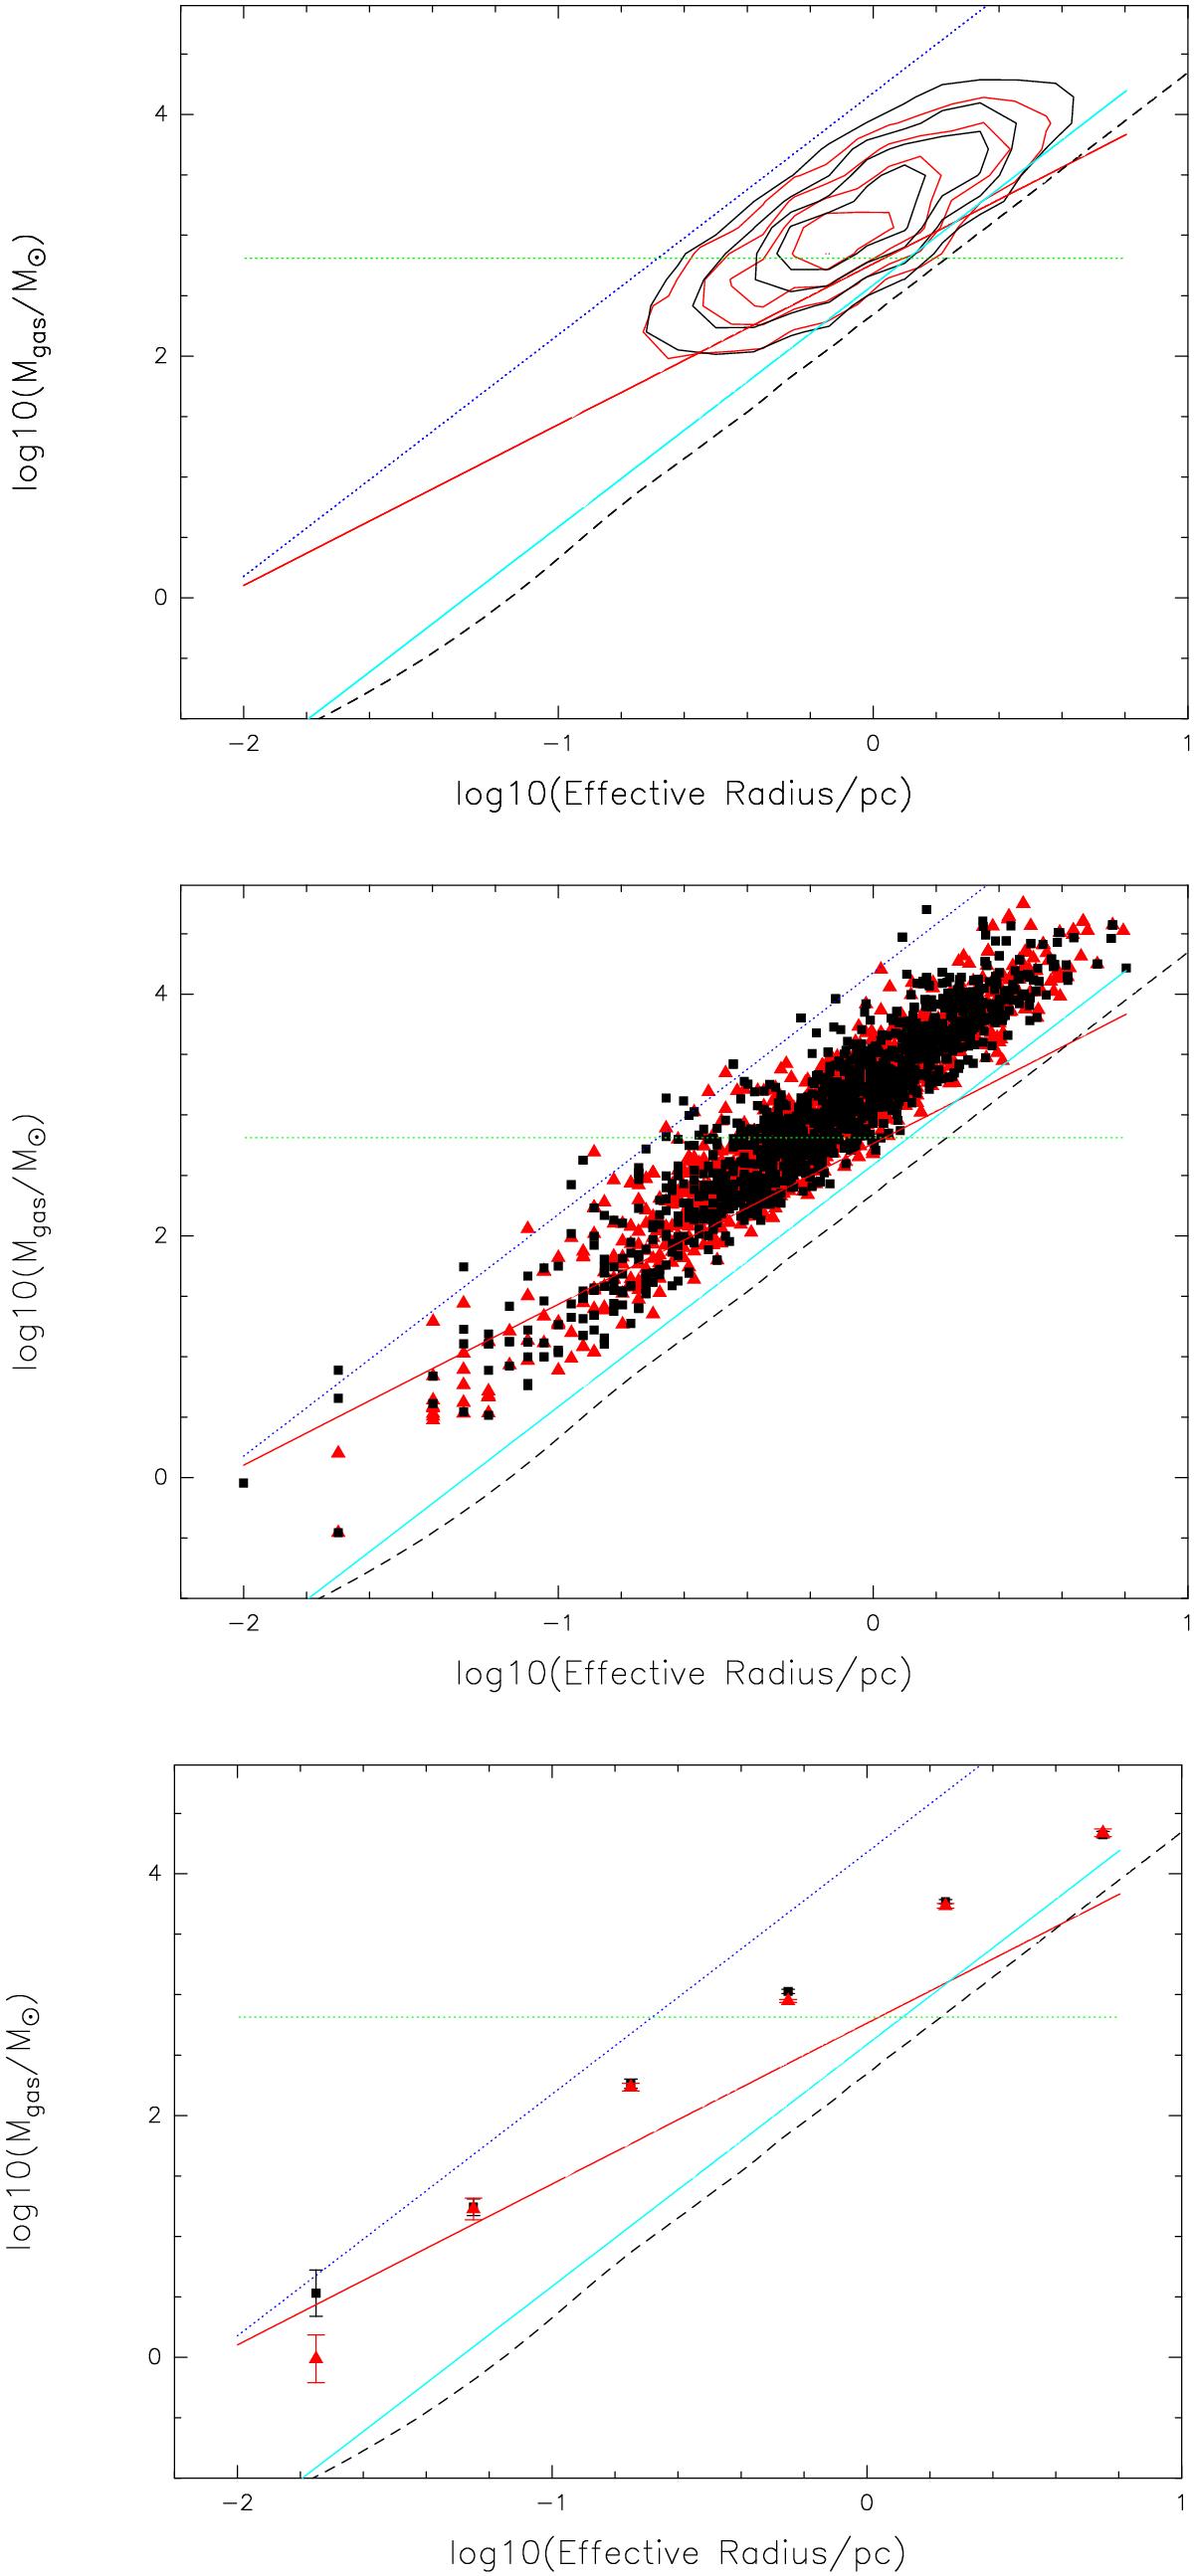
The mass-size relation for a cold and a warm ATLASGAL subsample (see Sect. 7.5) is shown as a red and black contour plot in the top panel, bins of 0.25 are used for the logarithm of the effective radius and bins of 0.2 for the logarithm of the gas mass. The scatter plot with the cold subsample as red triangles and the warm sources as black points is displayed in the middle panel. Mean values of the logarithm of the gas masses and of the effective radii are plotted in the bottom panel. The lines are the same as described in Sect. 7.5.
Current usage metrics show cumulative count of Article Views (full-text article views including HTML views, PDF and ePub downloads, according to the available data) and Abstracts Views on Vision4Press platform.
Data correspond to usage on the plateform after 2015. The current usage metrics is available 48-96 hours after online publication and is updated daily on week days.
Initial download of the metrics may take a while.