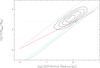
Fig. 23
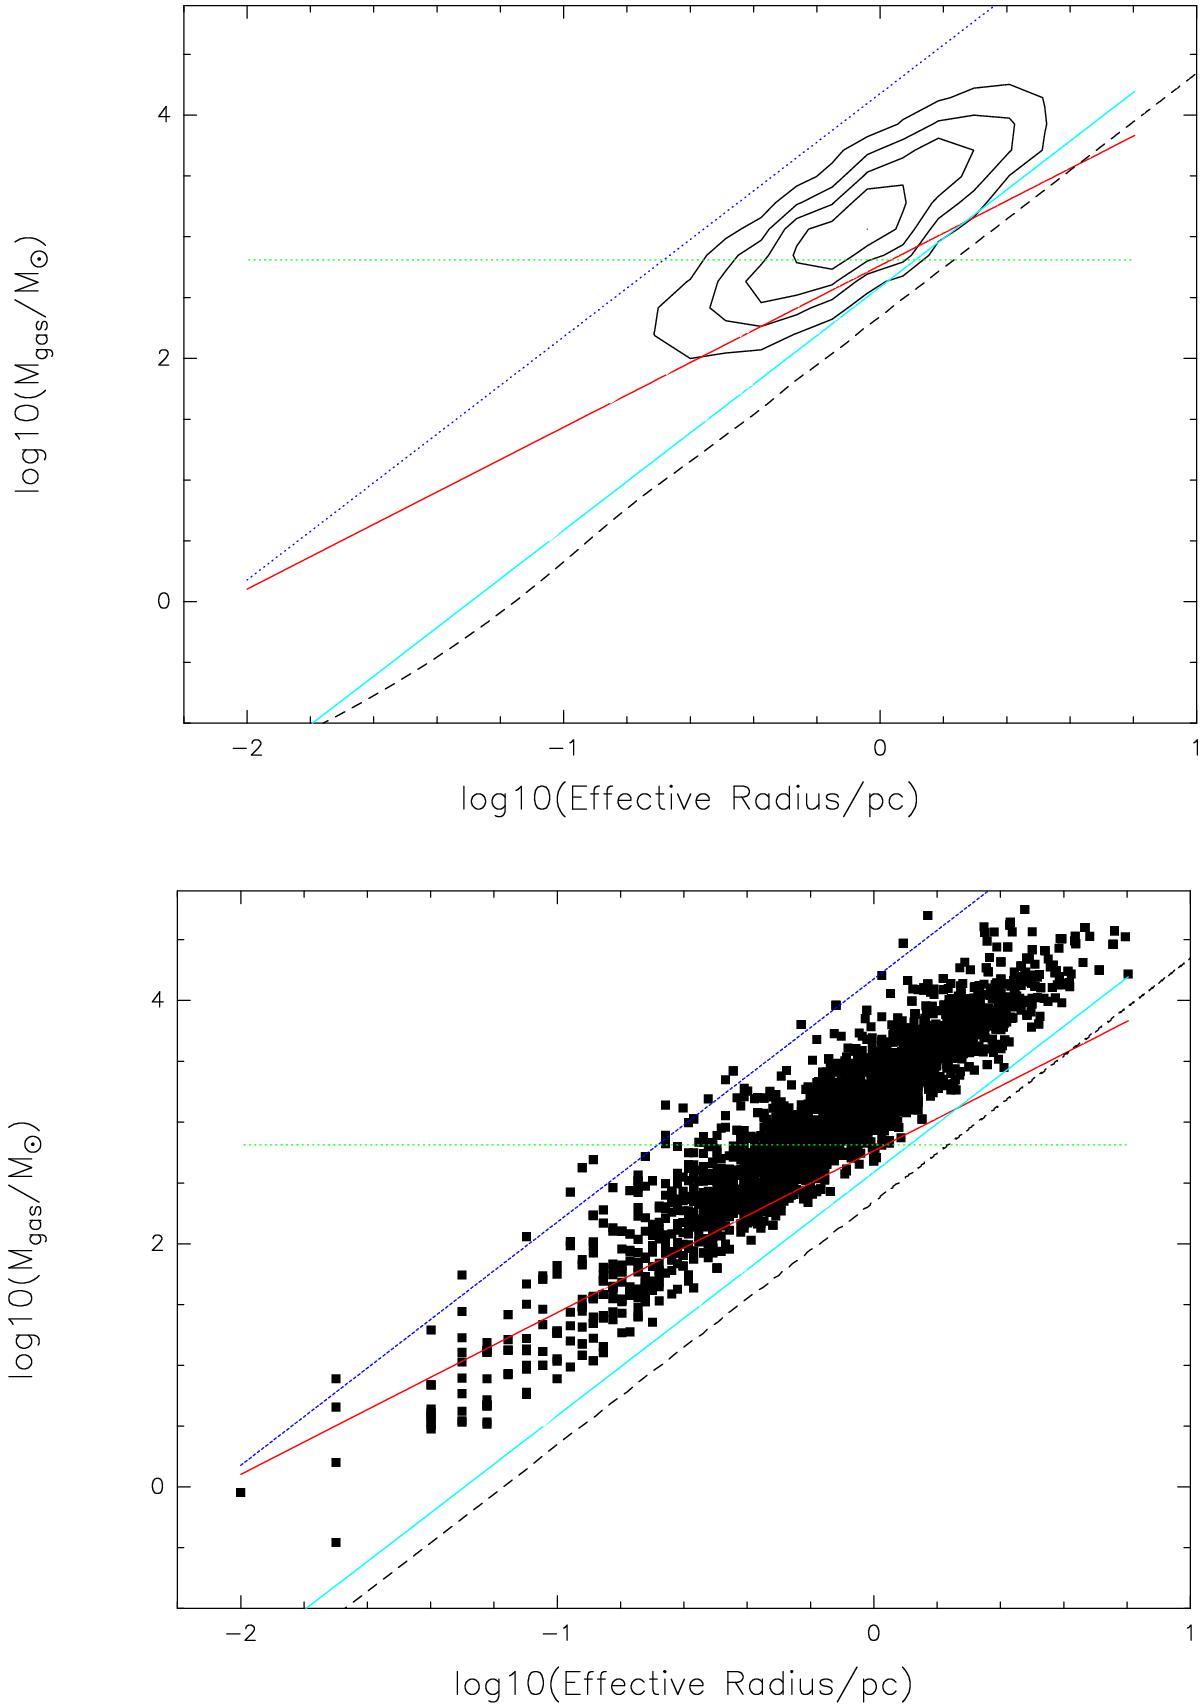
Logarithm of the gas mass compared with the logarithm of the effective radius of ATLASGAL sources. The red line illustrates the threshold of massive star formation by Kauffmann et al. (2010). The dotted green line illustrates a threshold of 650 M⊙ for the formation of high mass dense cores and massive protostars derived by Csengeri et al. (2014). Limit in gas surface density as average of 116 M⊙ pc-2 (Lada et al. 2010) and 129 ± 14M⊙ pc-2 (Heiderman et al. 2010) is displayed as light blue line. A gas surface density of 1 g cm-2 is shown as dotted blue line. The sensitivity of the ATLASGAL survey is displayed as dashed black line. The upper panel illustrates the contour plot with a binning of the logarithmic effective radius of 0.2 and the logarithmic gas mass of 0.2.
Current usage metrics show cumulative count of Article Views (full-text article views including HTML views, PDF and ePub downloads, according to the available data) and Abstracts Views on Vision4Press platform.
Data correspond to usage on the plateform after 2015. The current usage metrics is available 48-96 hours after online publication and is updated daily on week days.
Initial download of the metrics may take a while.