Fig. 21
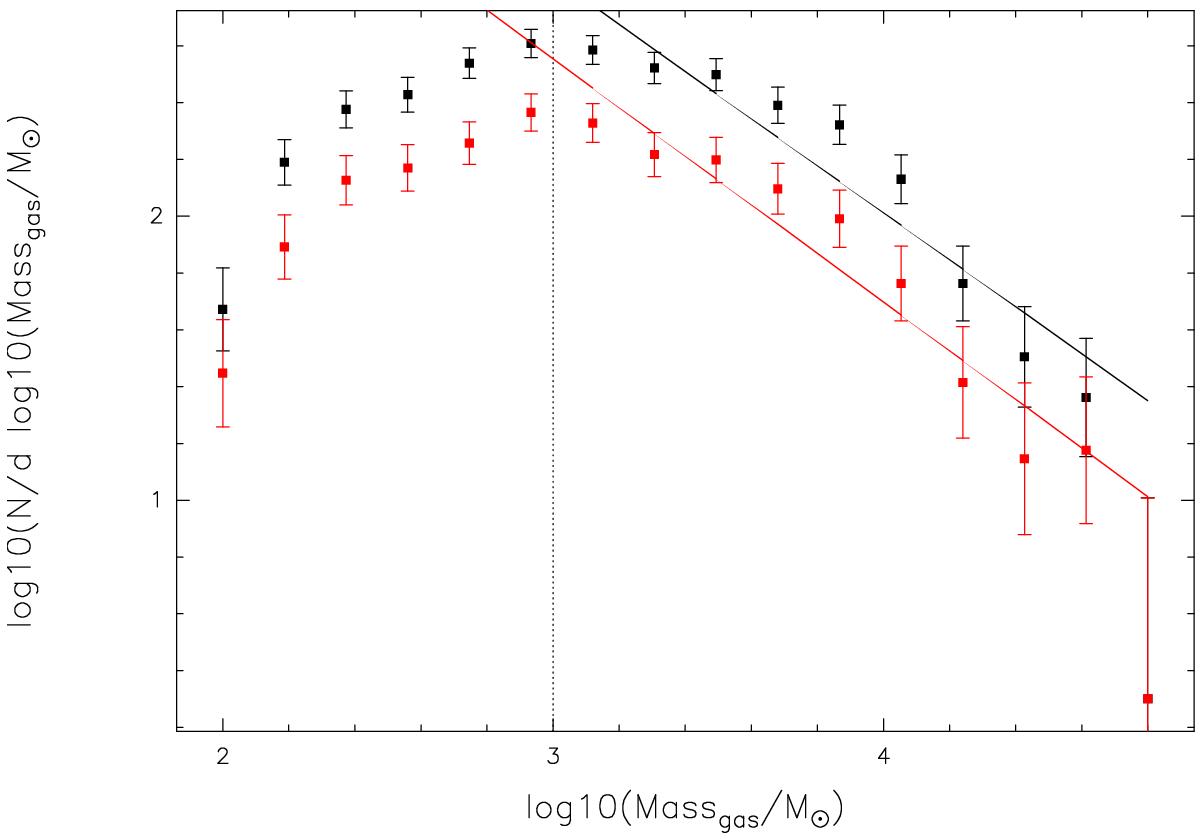
Similar slopes result from power-law fits to the differential mass function of the whole ATLASGAL sample in black and of a cold subsample in red with the ratio of the MSX 21 μm flux to the 870 μm peak flux density smaller than 0.8. The vertical line displays the completeness limit of 1000 M⊙, above which the mass spectra are fitted.
Current usage metrics show cumulative count of Article Views (full-text article views including HTML views, PDF and ePub downloads, according to the available data) and Abstracts Views on Vision4Press platform.
Data correspond to usage on the plateform after 2015. The current usage metrics is available 48-96 hours after online publication and is updated daily on week days.
Initial download of the metrics may take a while.