Fig. 20
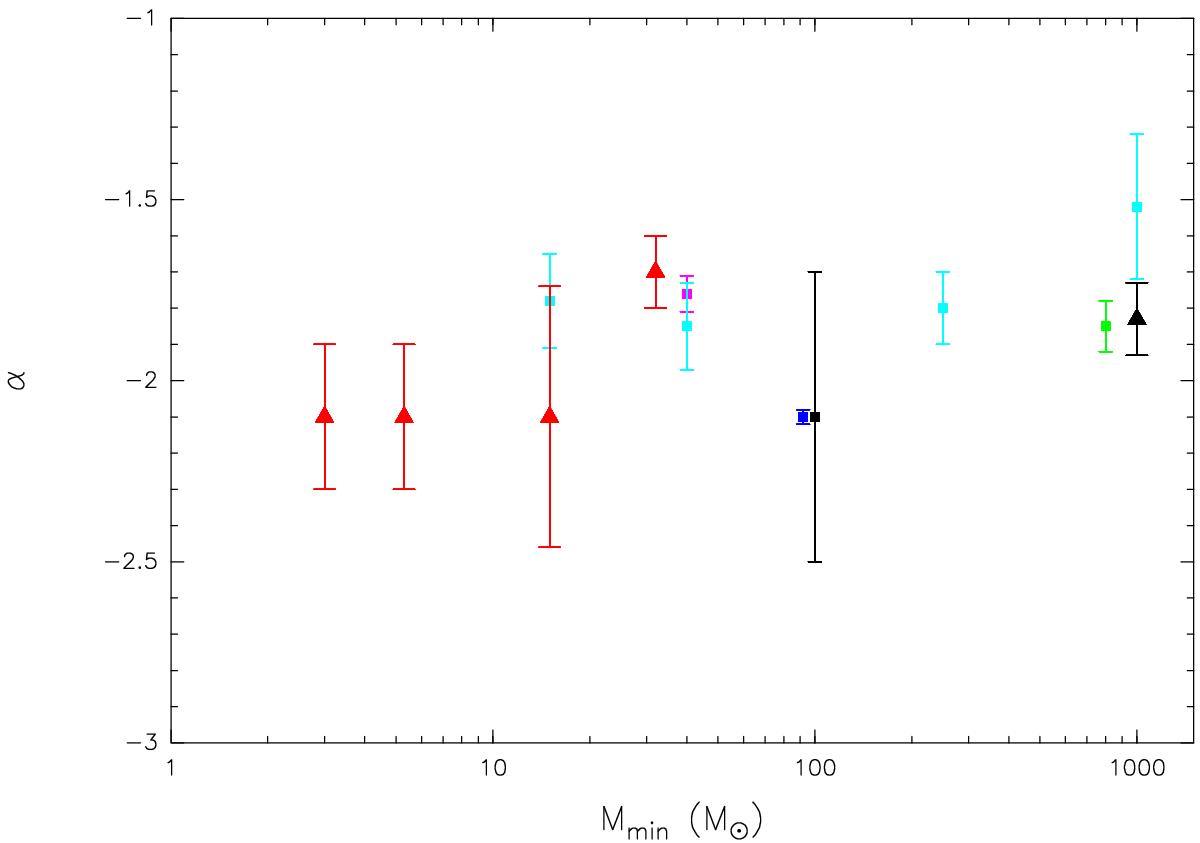
Slope of the mass functions is compared with the minimum mass for different high mass star forming samples from Table 5: cores within IRDCs are indicated as black point, clumps within IRDCs as purple point, IRDCs as green point, 1.2 mm dust clumps as blue point, clumps within GRS molecular clouds and W49 as light blue points, ATLASGAL sources as black triangle, M17, NGC 7538, Cygnus X, and NGC 6334 as red triangles.
Current usage metrics show cumulative count of Article Views (full-text article views including HTML views, PDF and ePub downloads, according to the available data) and Abstracts Views on Vision4Press platform.
Data correspond to usage on the plateform after 2015. The current usage metrics is available 48-96 hours after online publication and is updated daily on week days.
Initial download of the metrics may take a while.