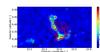
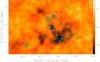
Fig. 2
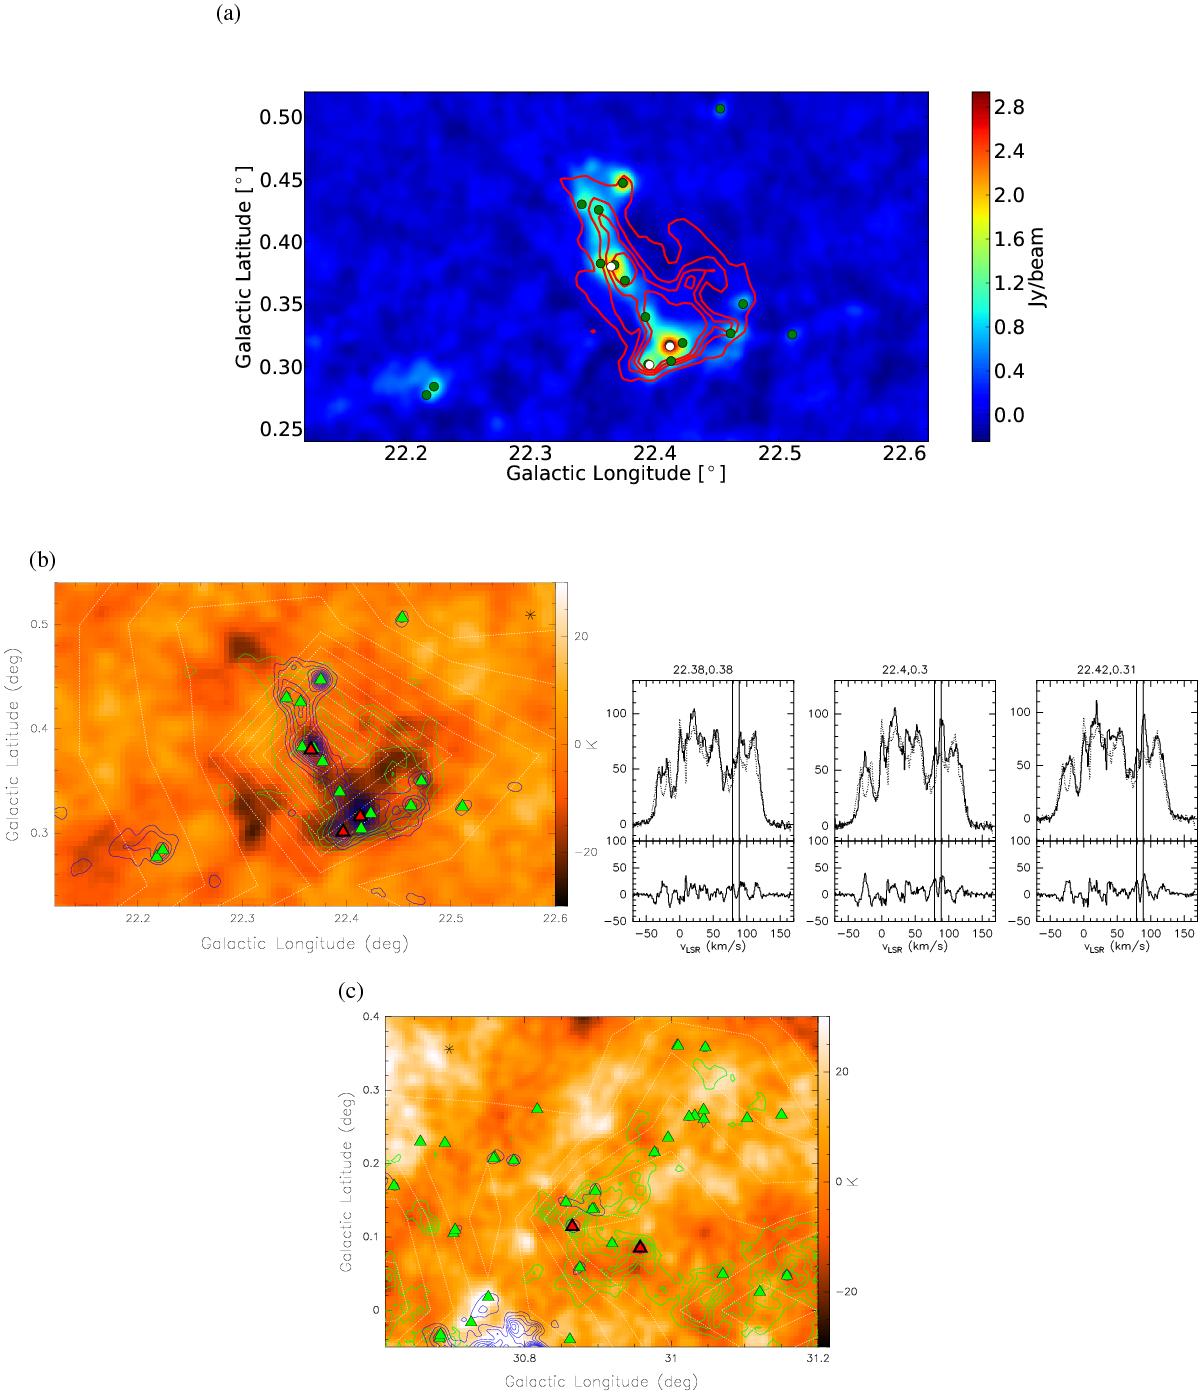
a) Example of a complex in the first quadrant: the 870 μm dust continuum is shown in the background probing the small-scale molecular cloud structure. We illustrate ATLASGAL sources with observed velocities of ~84 km s-1 as white dots and ATLASGAL sources without known velocities as green dots. The 13CO emission at the velocity of the complex is indicated as red contours. b) The panel on the left displays the HI emission map of the region shown in a) the HI intensity is integrated in the velocity interval around the group velocity and in intervals at smaller and larger velocities. The subtraction of these maps (see Sect. 5.2) reveals HI self-absorption plotted in the background with the 870 μm dust continuum overlaid as blue contours, the 13CO (1−0) emission as green contours, and the 12CO intensity as white contours. We show ATLASGAL sources with measured velocities as red triangles and ATLASGAL sources without velocities as green triangles. We extracted HI lines at the location of observed source and at one offset position, which is indicated by the star on the map. The HI “on-source” spectra are illustrated as solid lines and the “off-source” spectrum as dashed line in the panel on the right. The labels on the top display the galactic coordinates of observed source positions. Vertical lines in the spectra indicate the variation of the source velocity resulting from the velocity dispersion of clouds or streaming motions. The difference of the on-source and off-source spectra is shown below the HI spectra. c) Example of another region, which illustrates HI emission. The HI map in the background is produced and overlaid with the same contours and symbols as described for panel b).
Current usage metrics show cumulative count of Article Views (full-text article views including HTML views, PDF and ePub downloads, according to the available data) and Abstracts Views on Vision4Press platform.
Data correspond to usage on the plateform after 2015. The current usage metrics is available 48-96 hours after online publication and is updated daily on week days.
Initial download of the metrics may take a while.