Free Access
Fig. 19
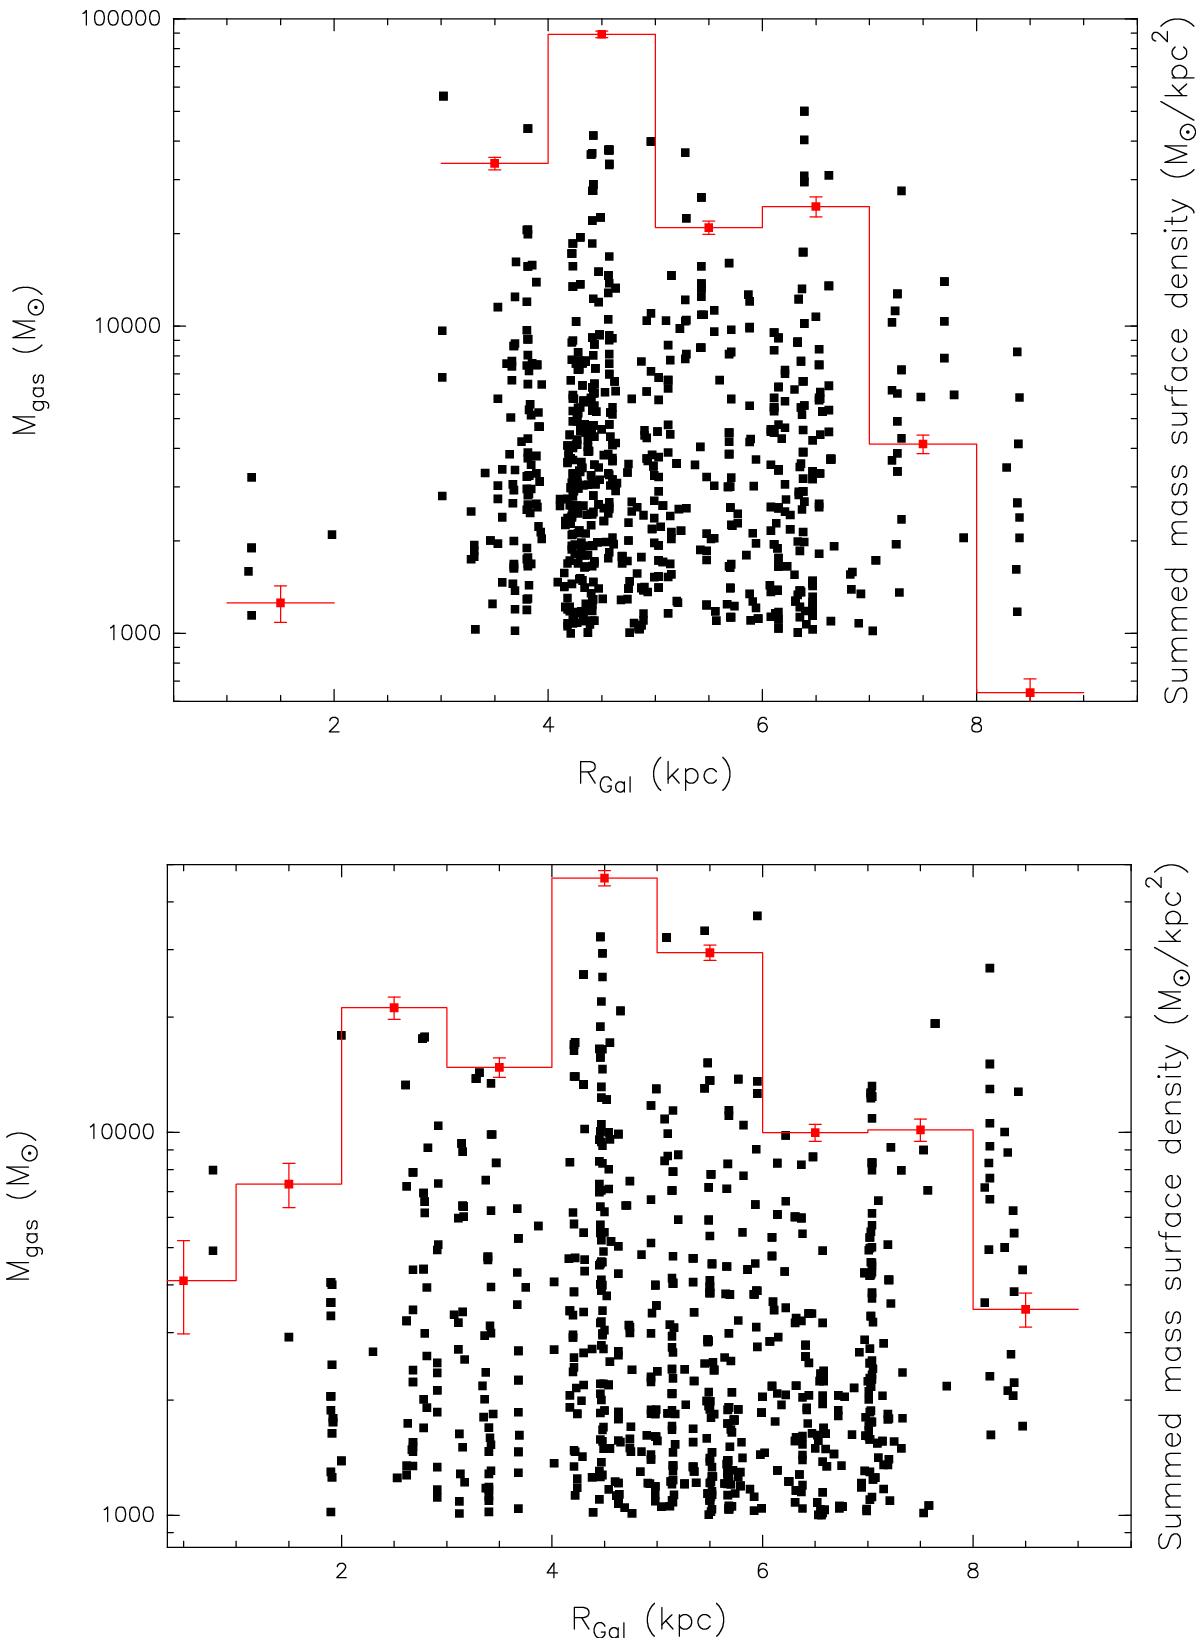
Distribution of gas masses above 1000 M⊙ is illustrated as black points in the upper panel for the ATLASGAL sources in the first quadrant and in the lower panel for clumps in the fourth quadrant. Red points indicate the sum of the gas mass surface density estimated in bins of 1 kpc in galactocentric radii.
This figure is made of several images, please see below:
Current usage metrics show cumulative count of Article Views (full-text article views including HTML views, PDF and ePub downloads, according to the available data) and Abstracts Views on Vision4Press platform.
Data correspond to usage on the plateform after 2015. The current usage metrics is available 48-96 hours after online publication and is updated daily on week days.
Initial download of the metrics may take a while.