Fig. 18
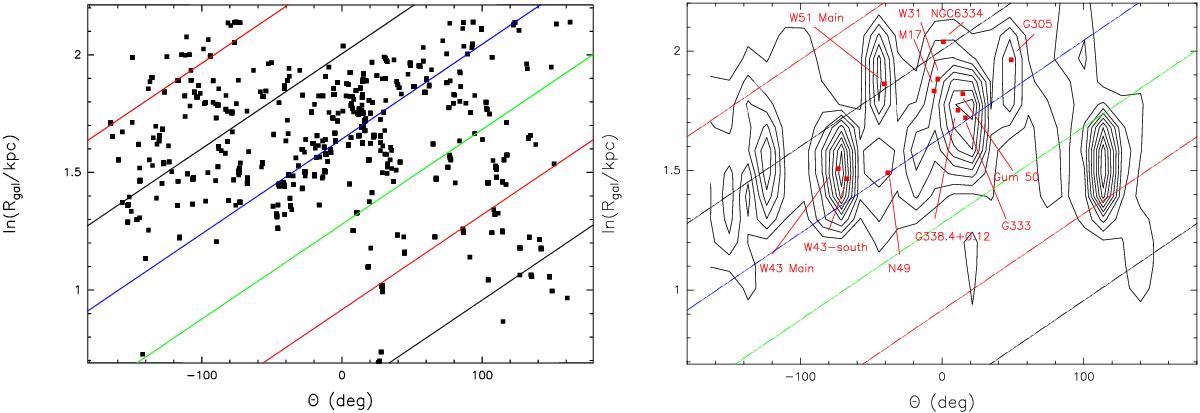
The logarithm of the galactocentric radius plotted against the azimuth, θ, of the ATLASGAL sources in the first and fourth quadrant above 1000 M⊙ as scatter plot in the left panel, clumps within 2 kpc of the galactic centre are excluded. The angle θ to the Galactic centre-Sun axis is counted anticlockwise as viewed from the north Galactic pole. The right panel displays the contour plot, for which we summed the clump mass in each azimuth bin of 10° and each logarithmic galactocentric radius bin of 0.2. The contours give 10 to 90% in steps of 10% of the peak summed clump mass per bin. The spiral arms originate from the model by Vallee (1995). The black, red, green, and blue lines indicate the Sagittarius arm, the Perseus arm, the 3-kpc arm, and the Scutum-Crux arm. Complexes with the largest number of sources are illustrated as red dots, most of them agree well with the enhancements of the summed mass.
Current usage metrics show cumulative count of Article Views (full-text article views including HTML views, PDF and ePub downloads, according to the available data) and Abstracts Views on Vision4Press platform.
Data correspond to usage on the plateform after 2015. The current usage metrics is available 48-96 hours after online publication and is updated daily on week days.
Initial download of the metrics may take a while.