Fig. 12
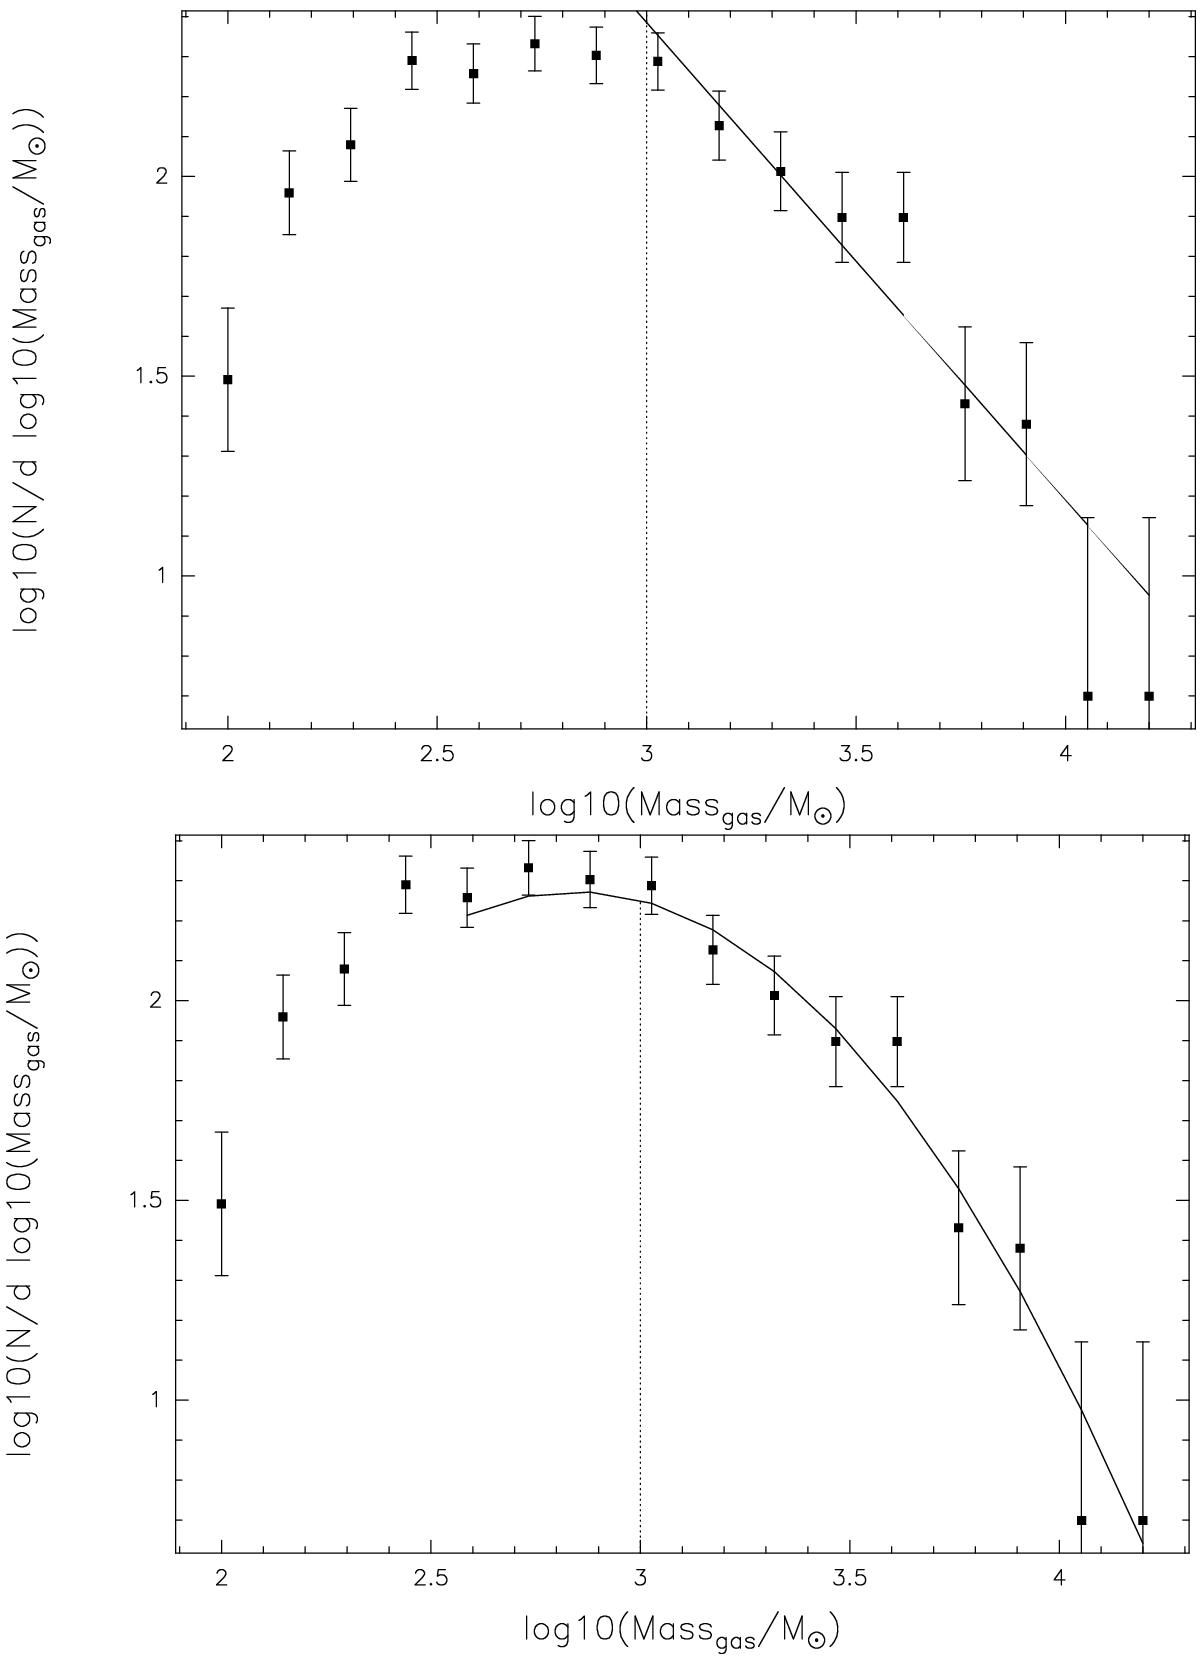
Differential clump mass function of ATLASGAL sources with distances from 2 to 5 kpc fitted to masses above 1000 M⊙ in the upper panel yields a power-law exponent of −2.19 ± 0.11. The vertical line displays the completeness limit of 1000 M⊙. A lognormal function is fitted to the mass distribution of this ATLASGAL subsample resulting in A = 188, Mpeak = 700 M⊙, and σ = 0.49. Mpeak is below the completeness limit and the peak itself is thus not well constrained.
Current usage metrics show cumulative count of Article Views (full-text article views including HTML views, PDF and ePub downloads, according to the available data) and Abstracts Views on Vision4Press platform.
Data correspond to usage on the plateform after 2015. The current usage metrics is available 48-96 hours after online publication and is updated daily on week days.
Initial download of the metrics may take a while.