Free Access
Fig. 11
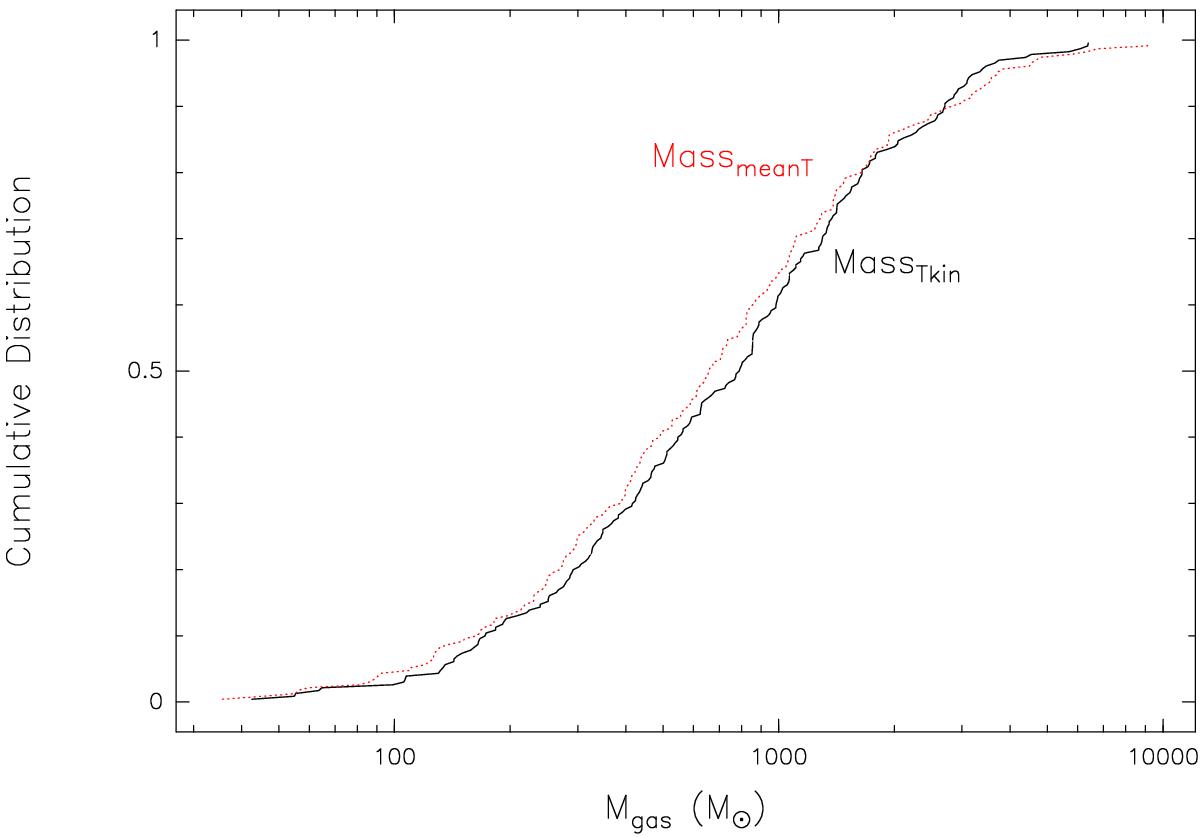
Cumulative distribution function of the gas mass, which is computed using the observed kinetic temperature of each source shown as solid black line and using the average kinetic temperature of the sample illustrated as dotted red line.
Current usage metrics show cumulative count of Article Views (full-text article views including HTML views, PDF and ePub downloads, according to the available data) and Abstracts Views on Vision4Press platform.
Data correspond to usage on the plateform after 2015. The current usage metrics is available 48-96 hours after online publication and is updated daily on week days.
Initial download of the metrics may take a while.