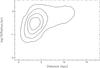
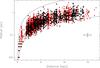
Fig. 10
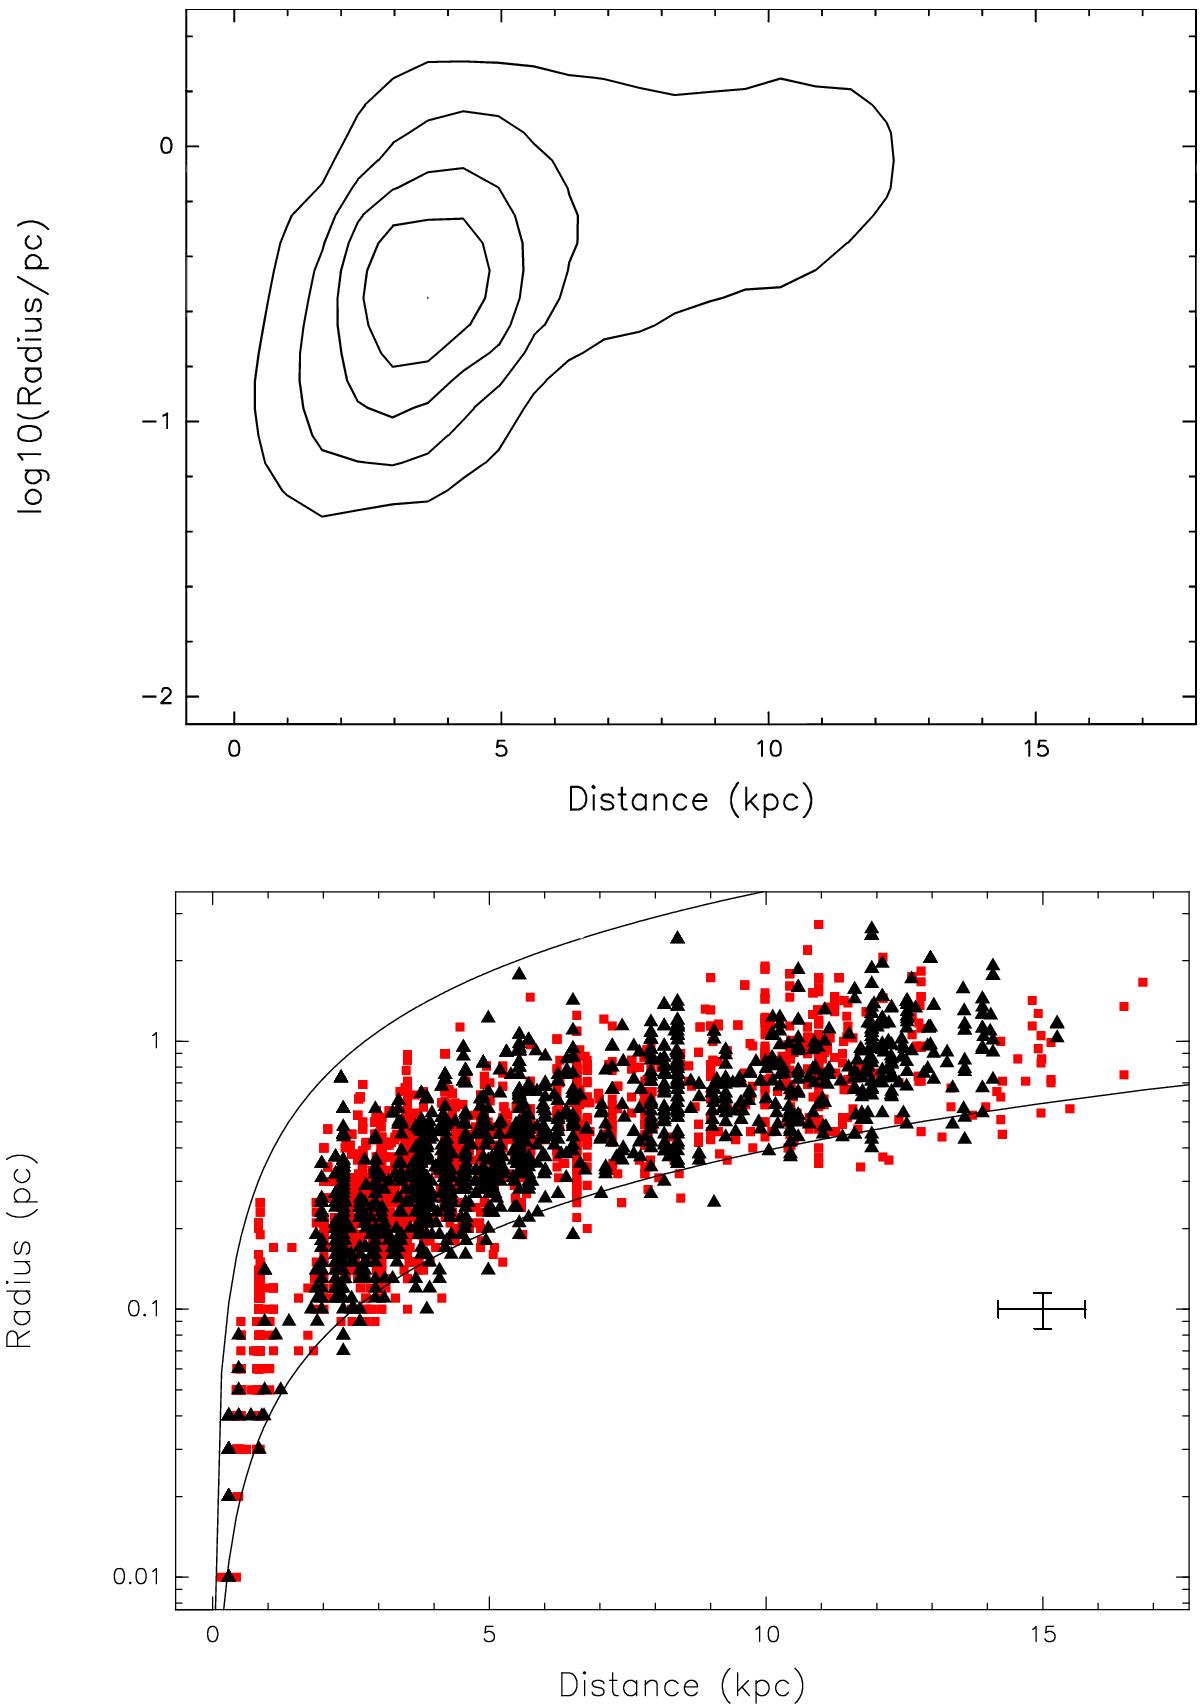
Dependence of the source radius not deconvolved from the beam on the kinematic distance to the ATLASGAL sample in the first quadrant as black triangles and the clumps in the fourth quadrant as red points is shown as scatter plot in the lower panel. The lower curve indicates radii corresponding to the beam radius of 9″, the upper curve illustrates radii computed with 1.3′. The binning of the kinematic distance in the contour plot in the upper panel is 1.5 kpc and that of the logarithm of the radius is 0.5. The contour levels from 10 to 90% are shown in intervals of 20% of the peak source number per bin. The error bar indicates the average distance and radius errors.
Current usage metrics show cumulative count of Article Views (full-text article views including HTML views, PDF and ePub downloads, according to the available data) and Abstracts Views on Vision4Press platform.
Data correspond to usage on the plateform after 2015. The current usage metrics is available 48-96 hours after online publication and is updated daily on week days.
Initial download of the metrics may take a while.