Fig. 26
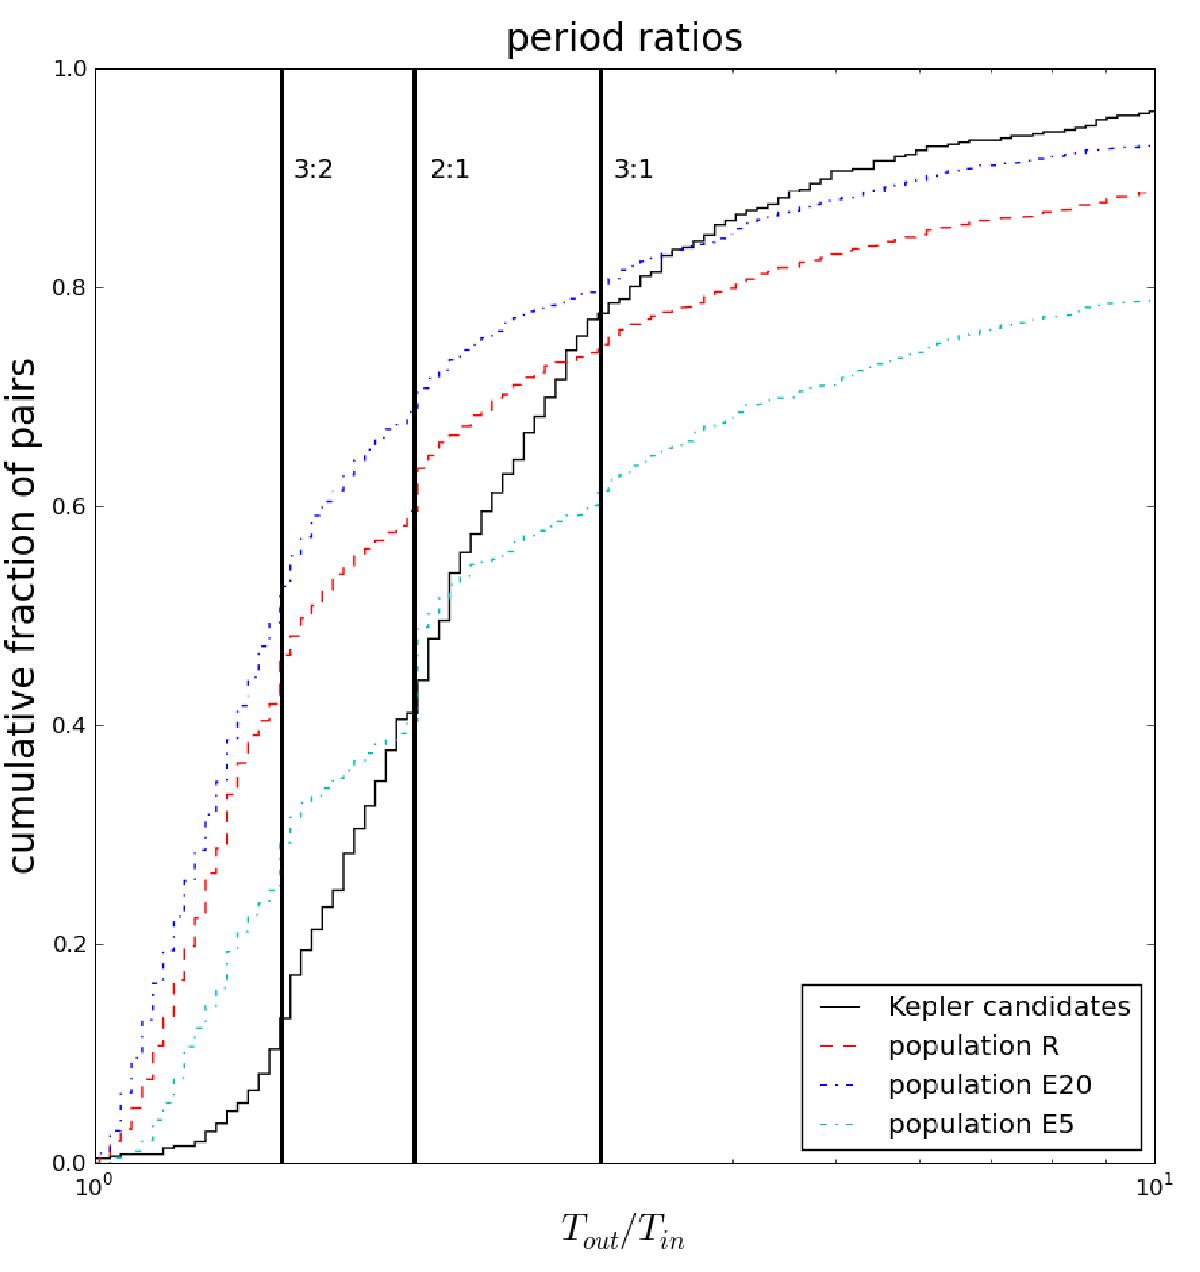
Comparison of the period ratios after 100 Myr for different planet populations. The black solid line denotes the distribution for Kepler planet candidates (data taken from www.exoplanets.org), the red dashed line for the reference population (R), the blue dot-dashed line for the population with 20 intial embryo seeds (E20), and the cyan dotted line for the population with five initial embryo seeds (E5).
Current usage metrics show cumulative count of Article Views (full-text article views including HTML views, PDF and ePub downloads, according to the available data) and Abstracts Views on Vision4Press platform.
Data correspond to usage on the plateform after 2015. The current usage metrics is available 48-96 hours after online publication and is updated daily on week days.
Initial download of the metrics may take a while.