Fig. 20
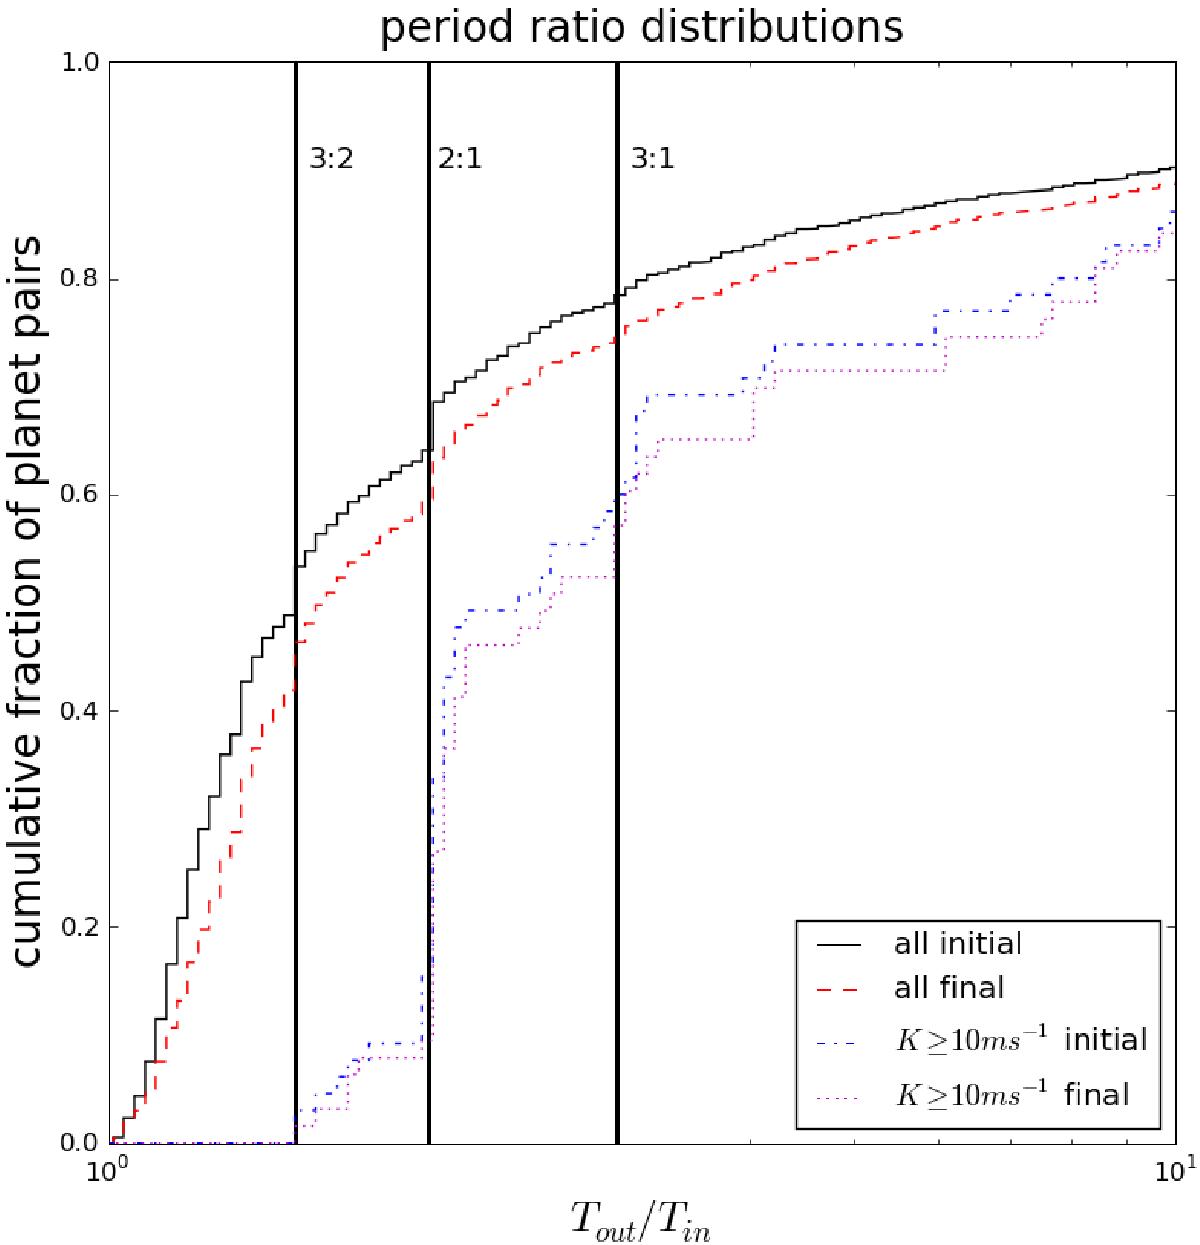
Period ratios for planet pairs in the reference population (R) for which both planets have K ≥ 10 m s-1. The black, solid line corresponds to the initial distribution for all planet pairs, the dashed, red line to the distribution after 100 Myr for all planet pairs. The blue dot-dashed line and the magenta dotted lines denote the initial and final distributions, respectively, for planet pairs where both planets have K ≥ 10 m s-1.
Current usage metrics show cumulative count of Article Views (full-text article views including HTML views, PDF and ePub downloads, according to the available data) and Abstracts Views on Vision4Press platform.
Data correspond to usage on the plateform after 2015. The current usage metrics is available 48-96 hours after online publication and is updated daily on week days.
Initial download of the metrics may take a while.