Fig. 16
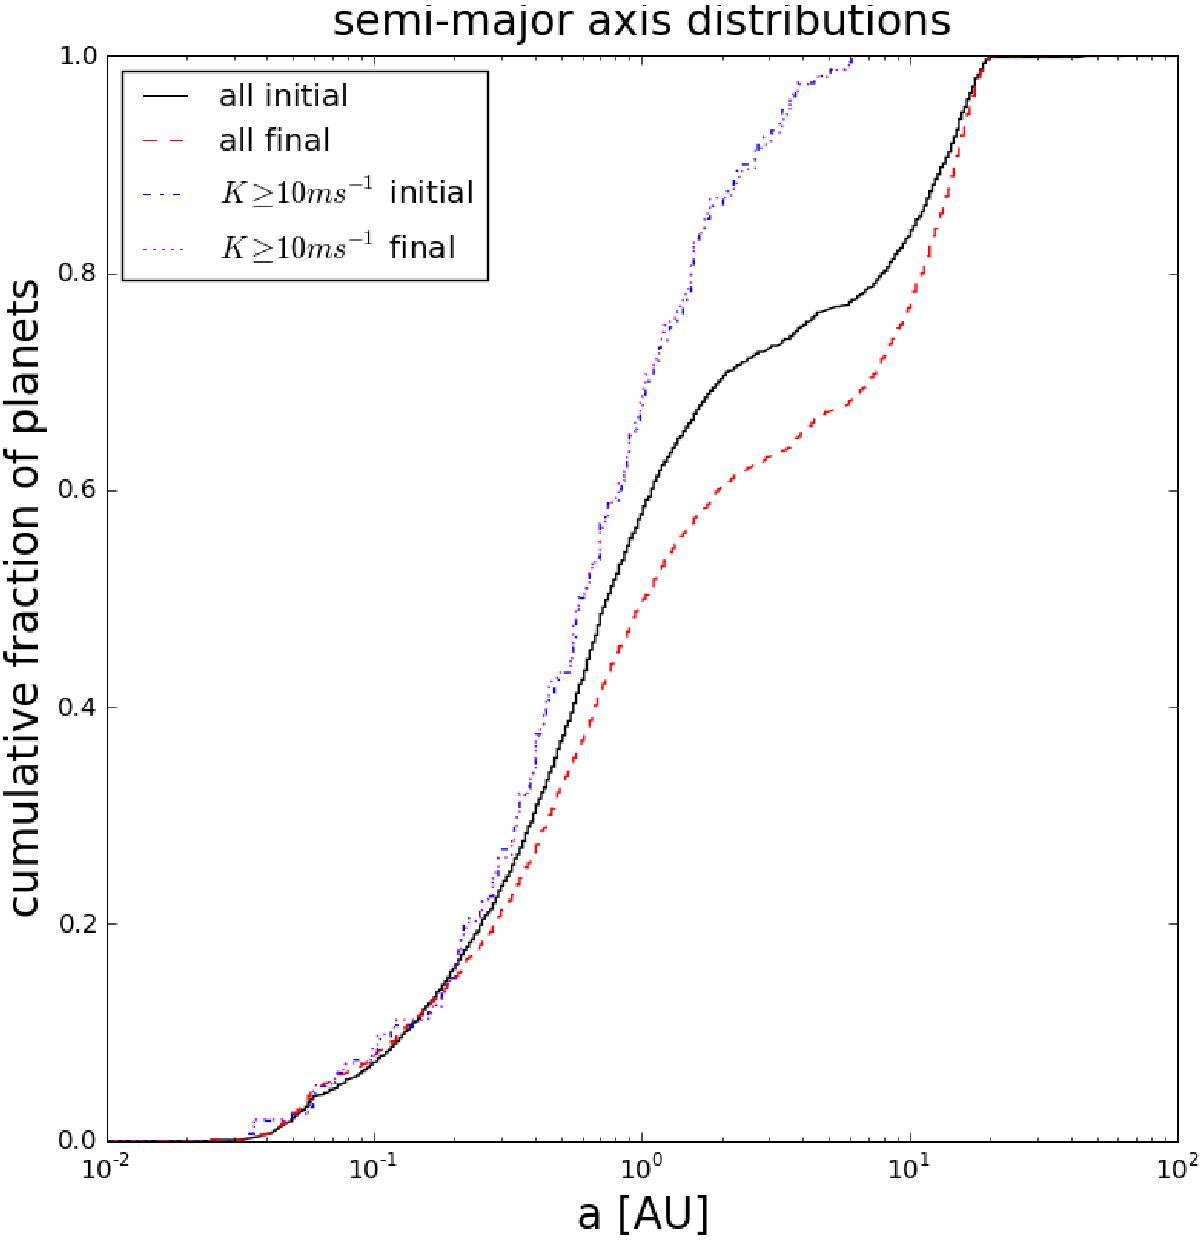
Semimajor axis distribution for all planets in the population with a larger number of initial embryo seeds (E20). The black solid line and the red dashed line correspond to the distributions at the time of disk dispersal and after 100 Myr, respectively. The blue dash-dotted line and the magenta dotted line correspond to the distributions at the time of disk dispersal and after 100 Myr, respectively, restricted to planets with K ≥ 10 m s-1.
Current usage metrics show cumulative count of Article Views (full-text article views including HTML views, PDF and ePub downloads, according to the available data) and Abstracts Views on Vision4Press platform.
Data correspond to usage on the plateform after 2015. The current usage metrics is available 48-96 hours after online publication and is updated daily on week days.
Initial download of the metrics may take a while.