Free Access
Fig. 13
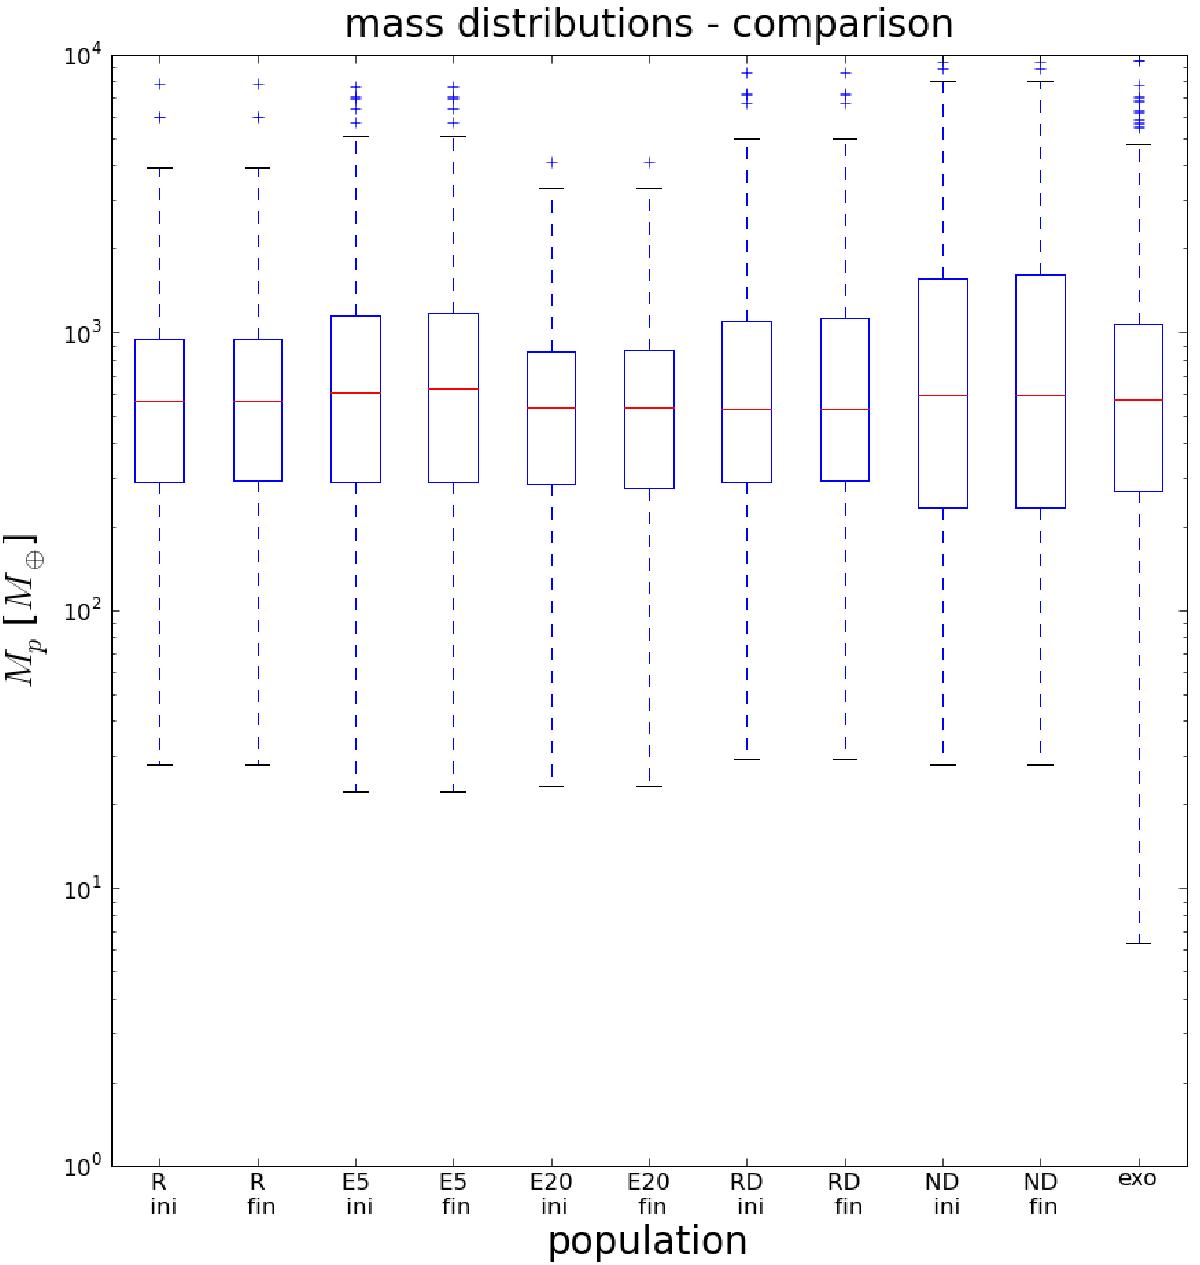
Comparison of the mass distributions for different populations of planets with K ≳ 10 m s-1. The red lines correspond to the median values, the blue boxes denote the interquartile ranges, while the whiskers correspond to five times the interquartile range. Values outside this range are denoted by a blue +–sign.
Current usage metrics show cumulative count of Article Views (full-text article views including HTML views, PDF and ePub downloads, according to the available data) and Abstracts Views on Vision4Press platform.
Data correspond to usage on the plateform after 2015. The current usage metrics is available 48-96 hours after online publication and is updated daily on week days.
Initial download of the metrics may take a while.