Fig. 8
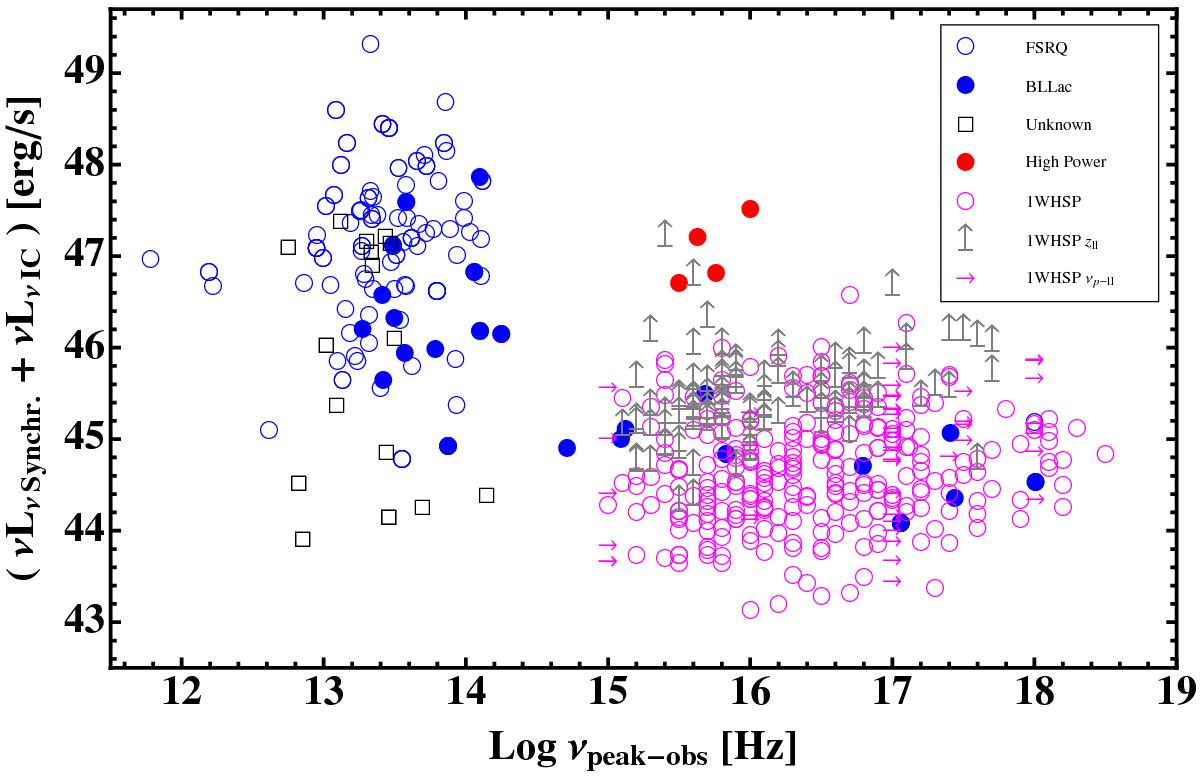
Bolometric luminosity vs. νpeak for our sample (magenta empty circles) compared with the sample reported by Giommi et al. (2012b; blue open and filled symbols) and the high-power HSP from Padovani et al. (2012b; red filled circles). Sources with only lower limits for the redshift are plotted as upward arrows, while sources with lower limits for νpeak are shown as right pointing arrows.
Current usage metrics show cumulative count of Article Views (full-text article views including HTML views, PDF and ePub downloads, according to the available data) and Abstracts Views on Vision4Press platform.
Data correspond to usage on the plateform after 2015. The current usage metrics is available 48-96 hours after online publication and is updated daily on week days.
Initial download of the metrics may take a while.