Free Access
Fig. 14
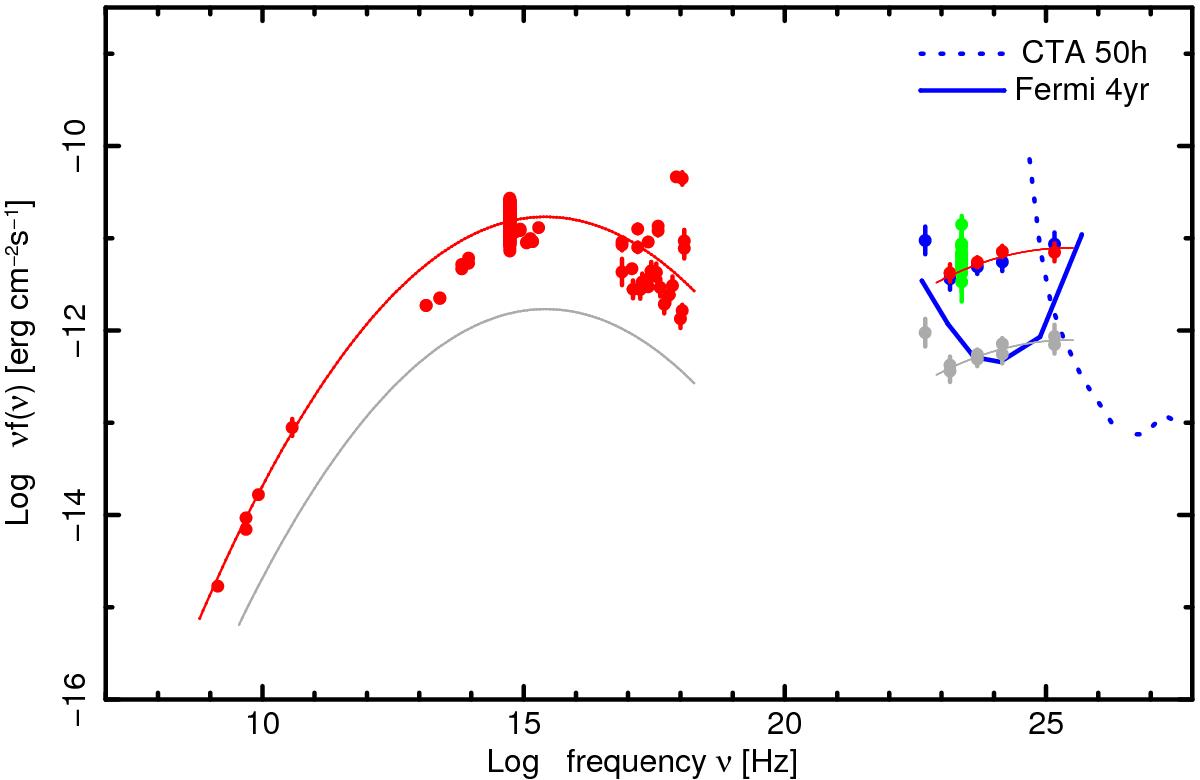
SED 1WHSPJ172504.3+115215. Sensitivities from Fermi-LAT four year exposure represented by the blue line and CTA with 50h exposure represented by the blue dashed line, which are equivalent to each other at ≈50 GeV.
Current usage metrics show cumulative count of Article Views (full-text article views including HTML views, PDF and ePub downloads, according to the available data) and Abstracts Views on Vision4Press platform.
Data correspond to usage on the plateform after 2015. The current usage metrics is available 48-96 hours after online publication and is updated daily on week days.
Initial download of the metrics may take a while.