Fig. 13
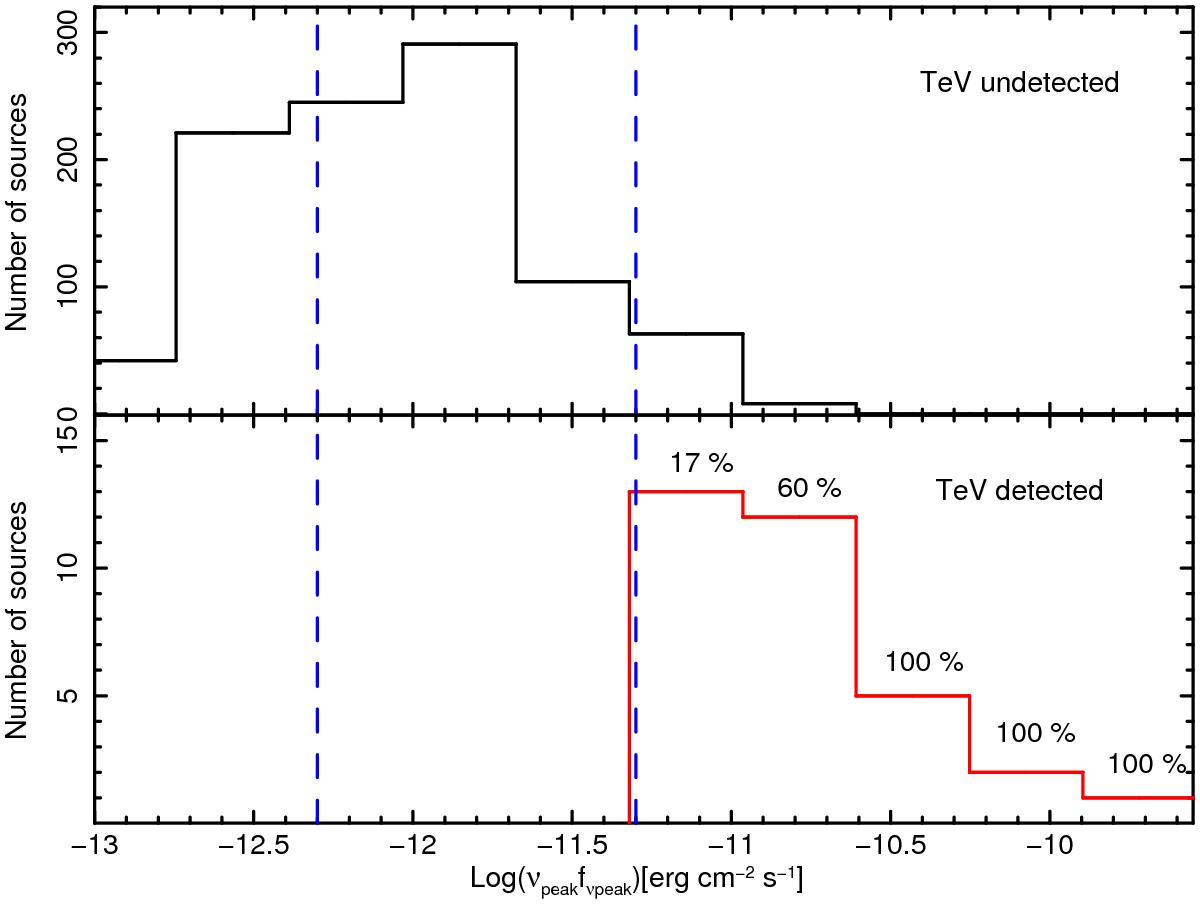
Distribution of synchrotron peak fluxes for the 1WHSP sources that have been detected so far (bottom panel) and that are still undetected in the TeV band (top panel). For each bin in νpeakFνpeak we report the percentage of 1WHSP sources that are already TeV detected. Central and left dashed lines correspond respectively to the detectability limit of present Cherenkov Telescopes and approximately to the future CTA.
Current usage metrics show cumulative count of Article Views (full-text article views including HTML views, PDF and ePub downloads, according to the available data) and Abstracts Views on Vision4Press platform.
Data correspond to usage on the plateform after 2015. The current usage metrics is available 48-96 hours after online publication and is updated daily on week days.
Initial download of the metrics may take a while.