Free Access
Fig. 11
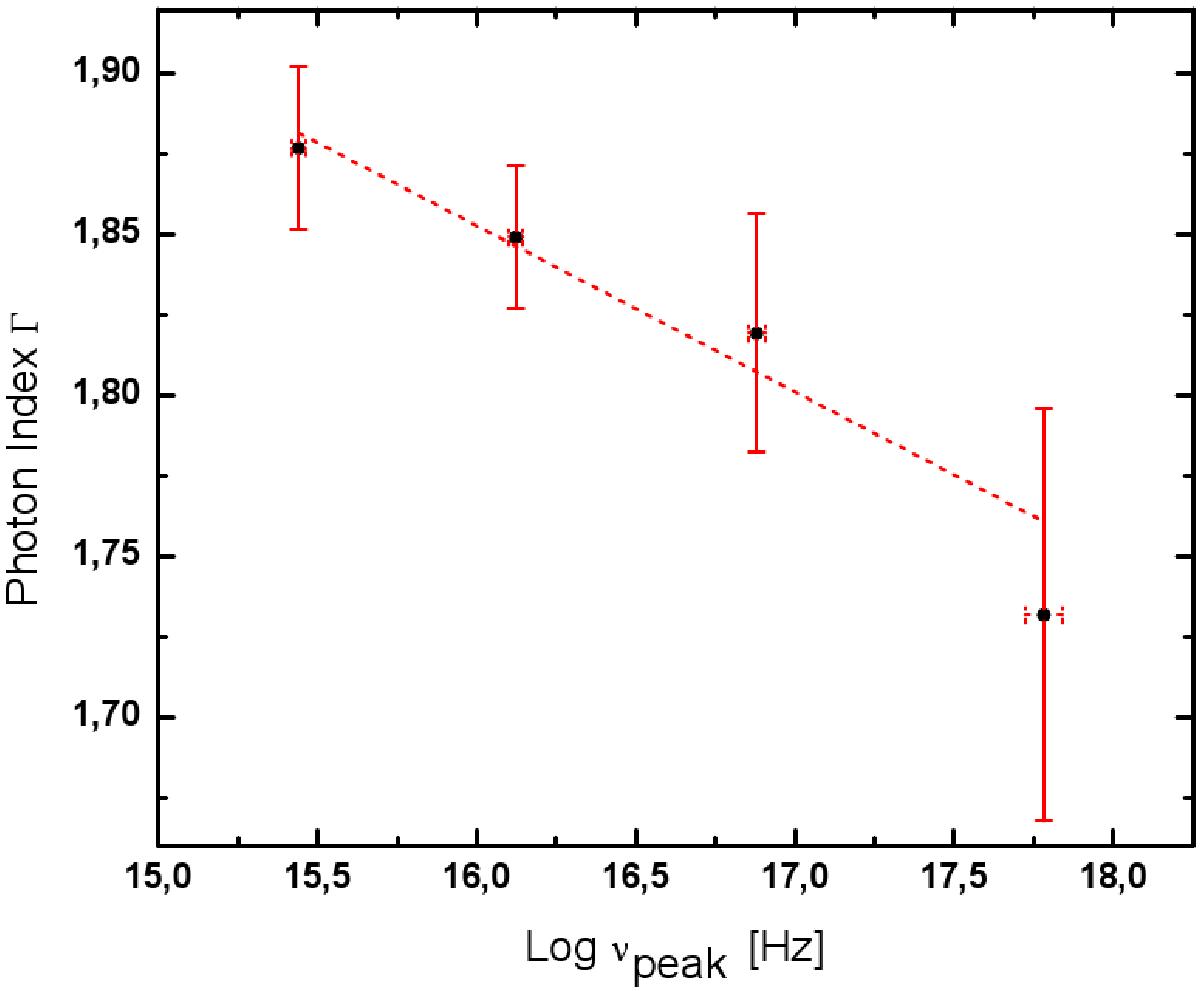
Average Fermi-LAT γ-ray photon spectral index of all HSPs in our sample detected by Fermi-LAT, binned in four intervals of log(νpeak), is plotted as a function of log(νpeak). The best-fit line corresponds to ΓFermi − LAT = -0.051 Log(νpeak) + 2.67.
Current usage metrics show cumulative count of Article Views (full-text article views including HTML views, PDF and ePub downloads, according to the available data) and Abstracts Views on Vision4Press platform.
Data correspond to usage on the plateform after 2015. The current usage metrics is available 48-96 hours after online publication and is updated daily on week days.
Initial download of the metrics may take a while.