Fig. 10
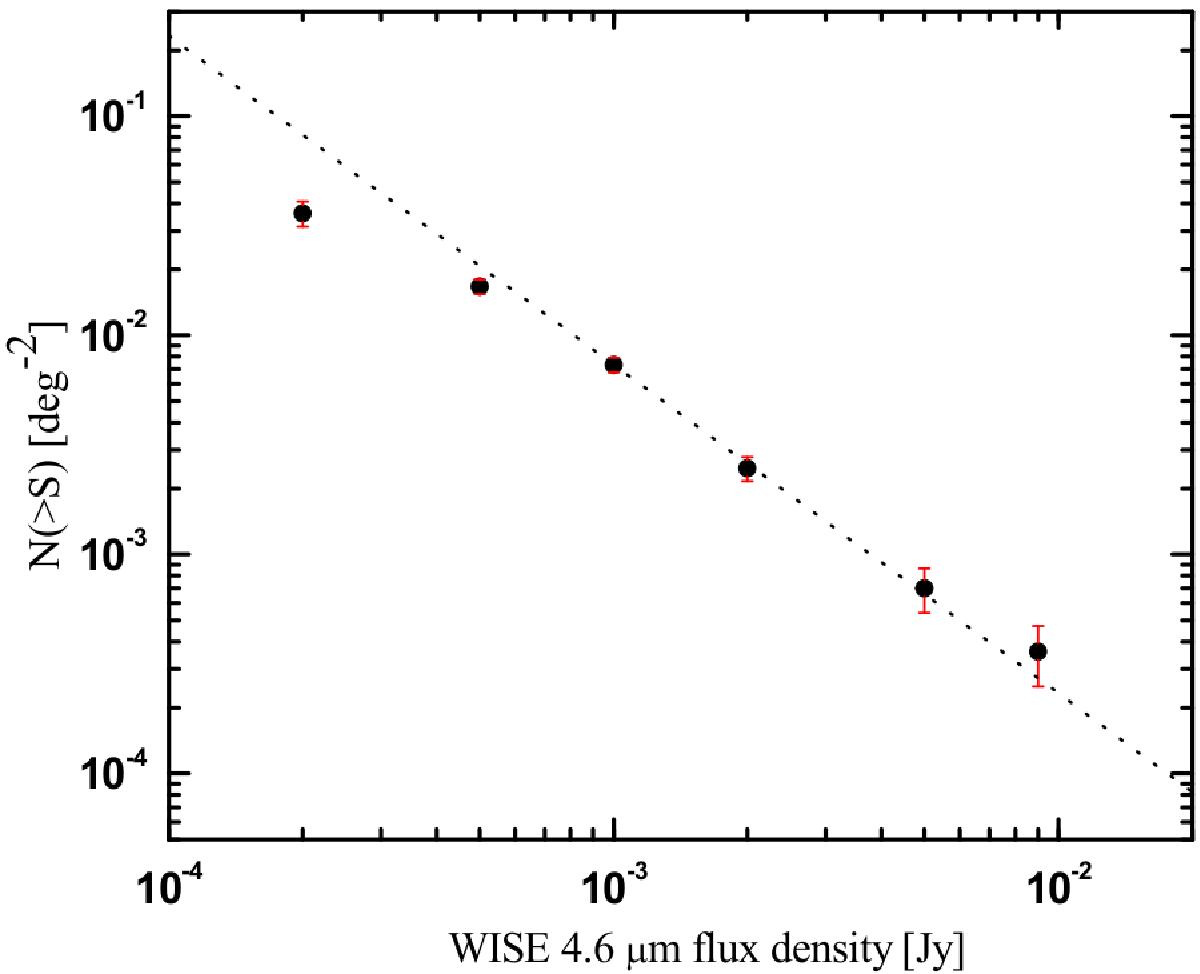
IR (4.6 μm) integral Log N–Log S distribution of HSP blazars. The dotted line, corresponding to N( >S) ∝ S-1.5, represents the expected distribution of a population of sources with constant density in a Euclidean universe. The flattening of the measurements compared to the straight line is, at least partly, because of sample incompleteness near the flux limit.
Current usage metrics show cumulative count of Article Views (full-text article views including HTML views, PDF and ePub downloads, according to the available data) and Abstracts Views on Vision4Press platform.
Data correspond to usage on the plateform after 2015. The current usage metrics is available 48-96 hours after online publication and is updated daily on week days.
Initial download of the metrics may take a while.