Free Access
Fig. 3
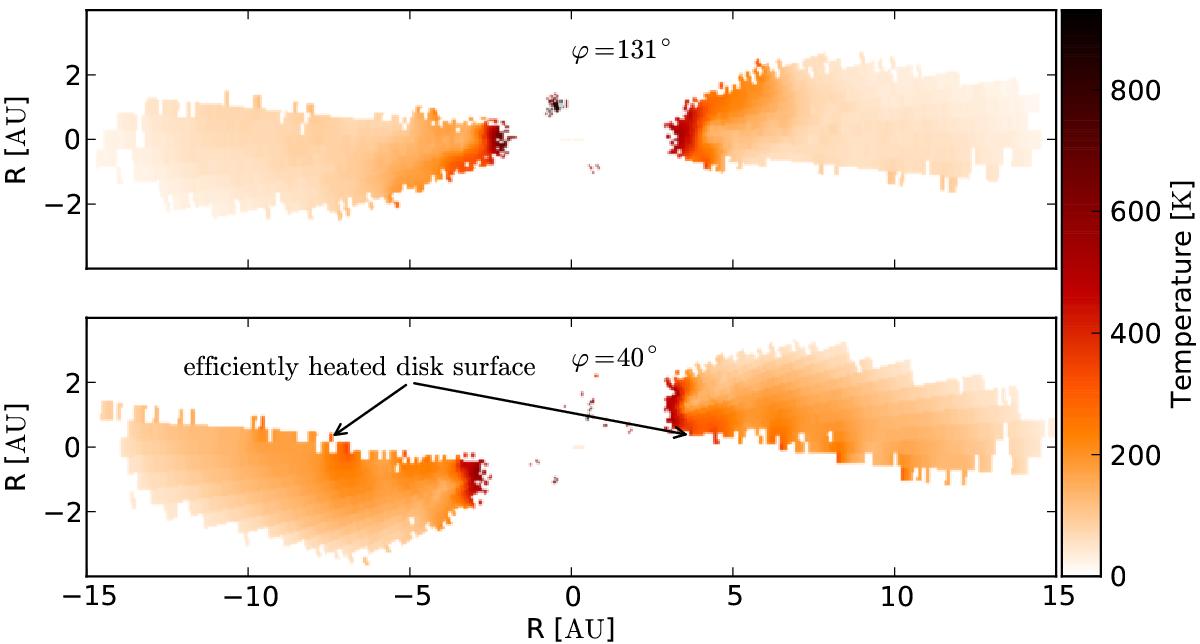
Temperature maps along vertical cuts through the density distributions of the disk model with the parameters q = 0.1, i = 30°, and e = 0.0 shown in the top right corner in Fig. 2.
Current usage metrics show cumulative count of Article Views (full-text article views including HTML views, PDF and ePub downloads, according to the available data) and Abstracts Views on Vision4Press platform.
Data correspond to usage on the plateform after 2015. The current usage metrics is available 48-96 hours after online publication and is updated daily on week days.
Initial download of the metrics may take a while.