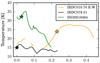
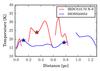
Fig. 10
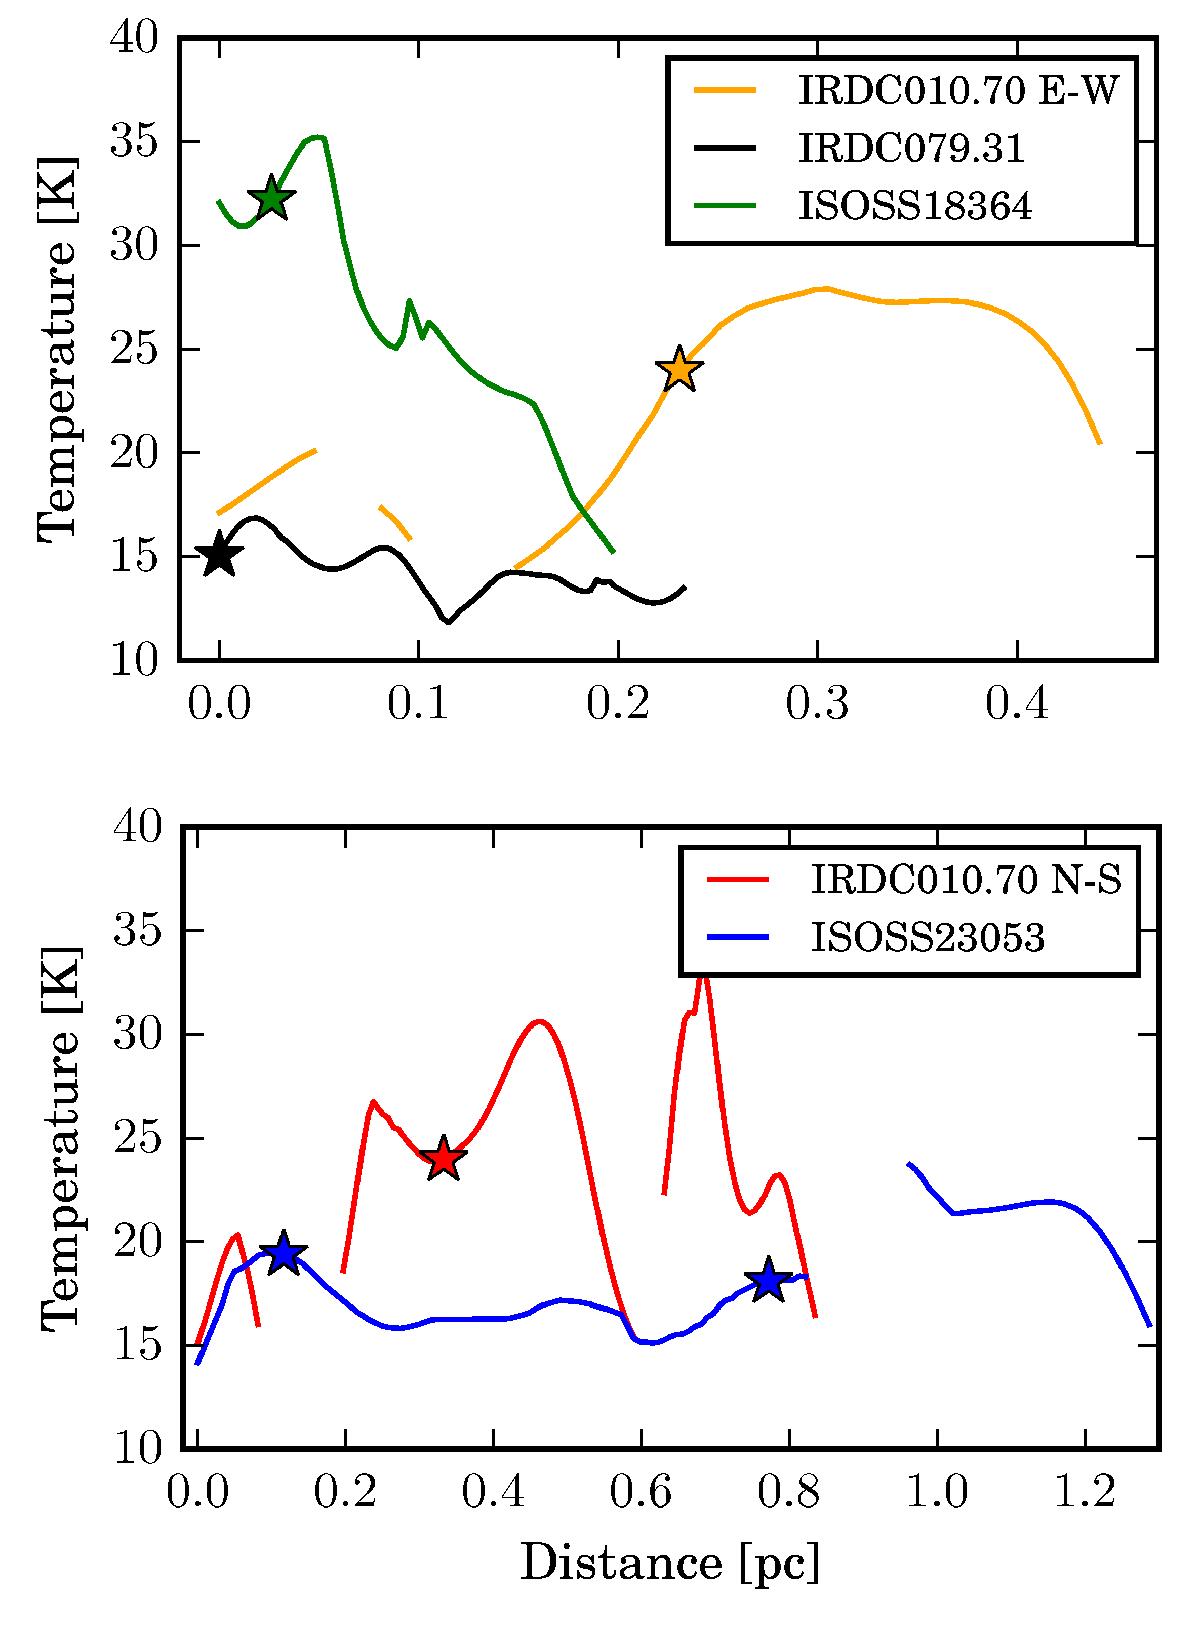
Temperature distribution as a function of the distance along the lines shown in the lower right panels of Figs. 1–3, and 6. In the top panel, the yellow, black, and green lines show the temperature distributions of the sources IRDC010.70 (along east-west), IRDC079.31 and ISOSS18364, respectively. The red and blue lines in the bottom panel show the temperature distributions of the sources IRDC010.70 (along north–south) and ISOSS23053, respectively. The x-axes (distance) are different for the top and bottom panels. The stars mark the positions of corresponding 70 μm emission sources.
Current usage metrics show cumulative count of Article Views (full-text article views including HTML views, PDF and ePub downloads, according to the available data) and Abstracts Views on Vision4Press platform.
Data correspond to usage on the plateform after 2015. The current usage metrics is available 48-96 hours after online publication and is updated daily on week days.
Initial download of the metrics may take a while.