Fig. 1
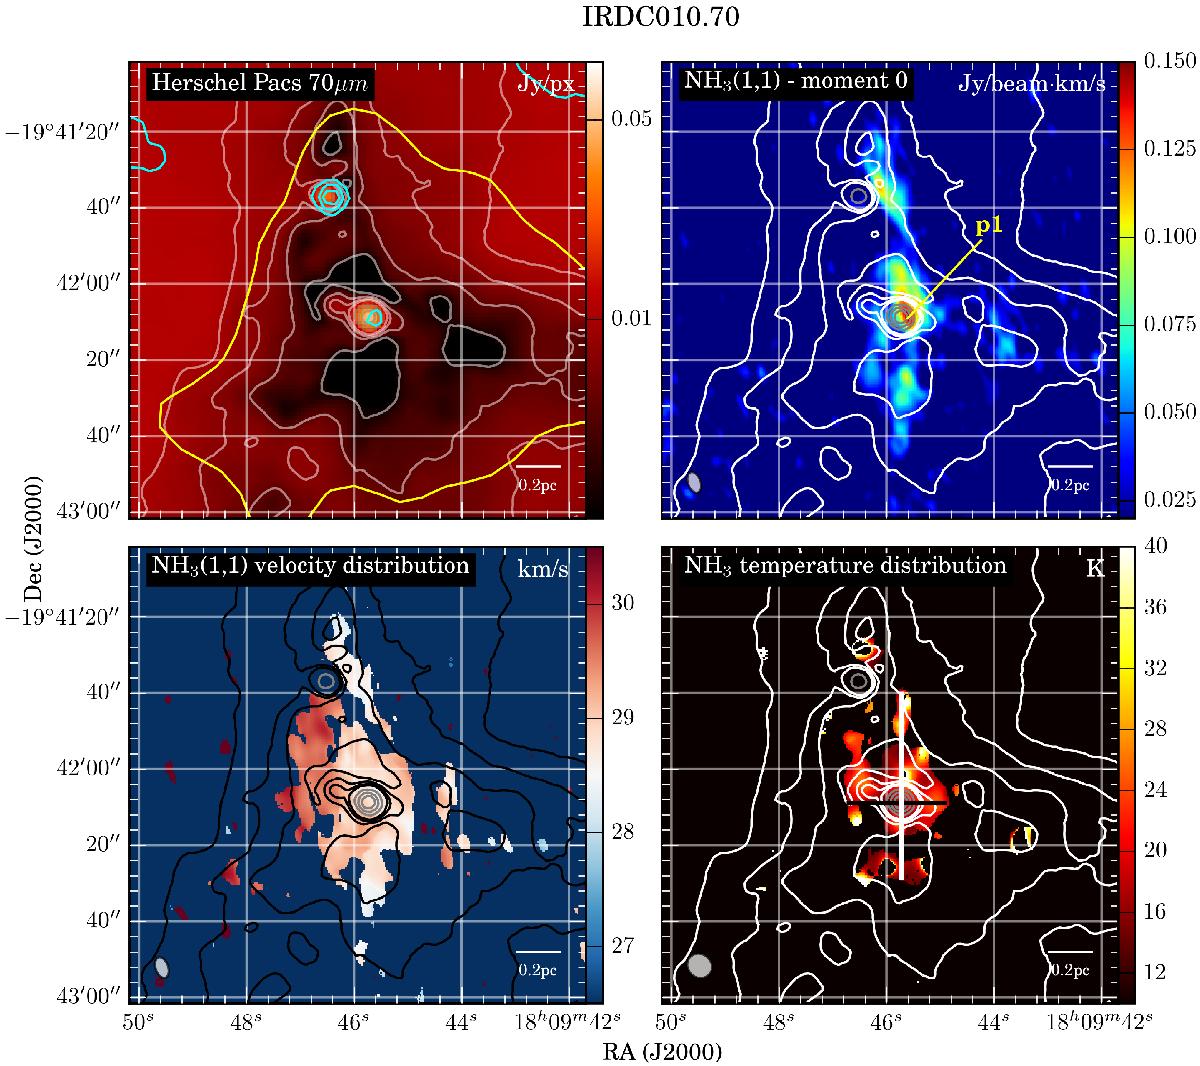
IRDC010.70 – overview. Upper left panel: Herschel PACS 70 μm emission and cyan contours present Spitzer MIPS 24 μm emission at levels of 90, 110, 130, and 150 MJy/sr. The yellow contour shows the 3-sigma limit of the SCUBA 850 μm emission and therefore the area where we measured the clump mass. Following panels: VLA data. Upper right panel: integrated emission of the main NH3(1, 1) line in Jy beam-1 km s-1 from 27.1 to 30.3 km s-1. Lower left panel: peak velocity distribution in km s-1. Lower right panel: kinetic temperature in K. We extracted the temperature distribution along the black and white lines shown in the lower right panel and plotted the values as a function of distance in Fig. 10. In each panel contours present Herschel PACS 70 μm emission at levels of 2.5, 5, 7.5, and 10 mJy/px for white/black contours and 20, 30, 40, and 50 mJy/px for gray contours. The NH3(1, 1) emission peak is marked in the upper right panel, and the corresponding spectra are given in Fig. A.1. The synthesized beam and scale are shown in each panel.
Current usage metrics show cumulative count of Article Views (full-text article views including HTML views, PDF and ePub downloads, according to the available data) and Abstracts Views on Vision4Press platform.
Data correspond to usage on the plateform after 2015. The current usage metrics is available 48-96 hours after online publication and is updated daily on week days.
Initial download of the metrics may take a while.