Free Access
Fig. 3
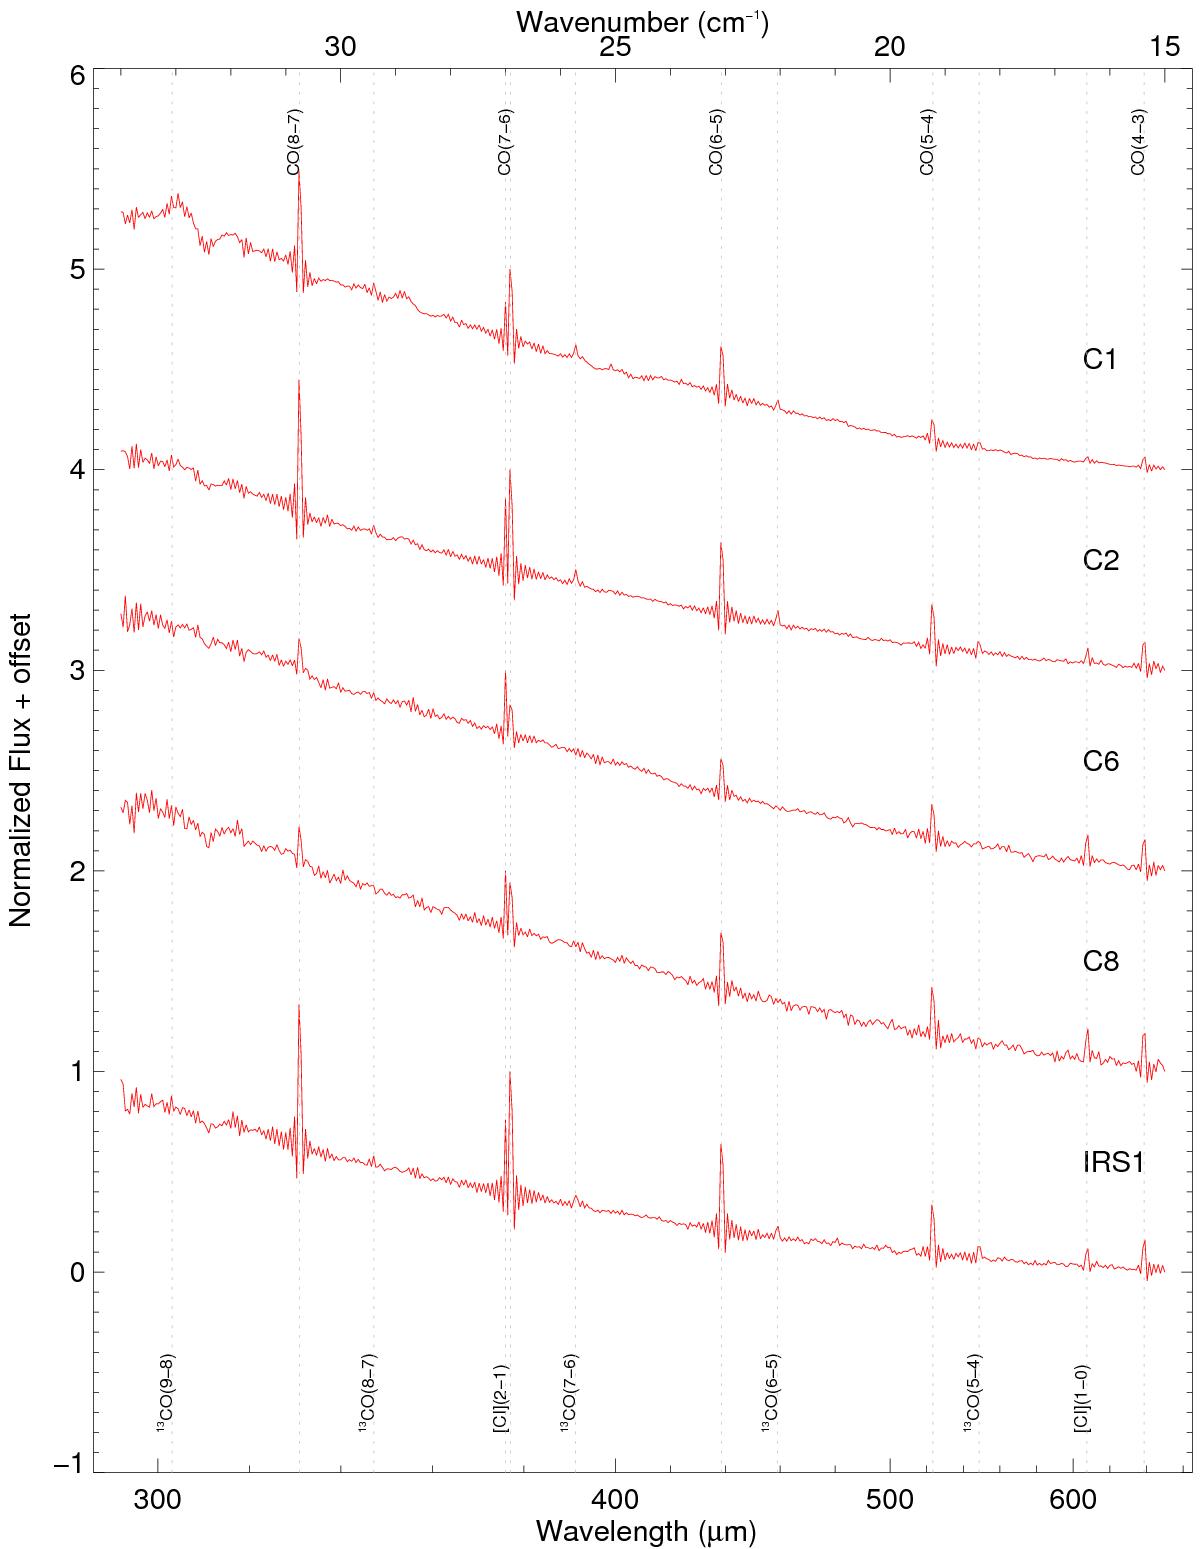
SPIRE-FTS SLW spectra towards the richest pointings, at the position of the central pixels (see Sect. 3). The spectra are normalized at the brightest line on each spectrum. The lines detected are marked and labeled.
Current usage metrics show cumulative count of Article Views (full-text article views including HTML views, PDF and ePub downloads, according to the available data) and Abstracts Views on Vision4Press platform.
Data correspond to usage on the plateform after 2015. The current usage metrics is available 48-96 hours after online publication and is updated daily on week days.
Initial download of the metrics may take a while.