Fig. 3
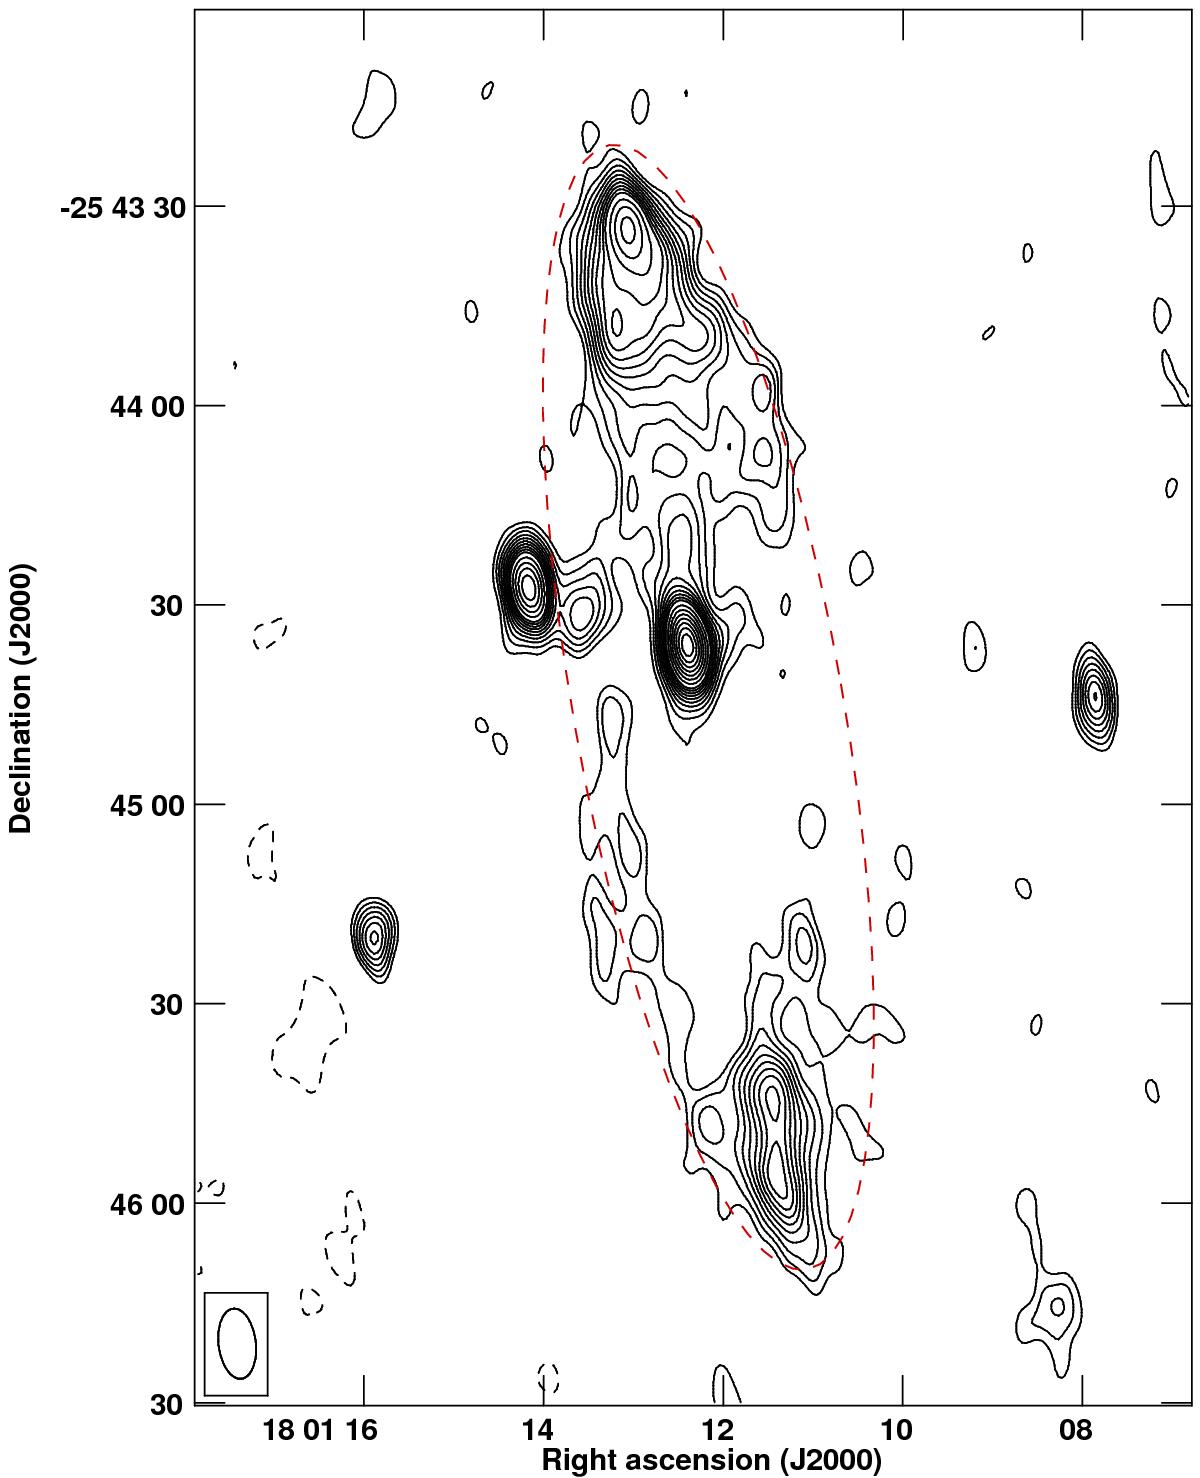
Natural-weight 6 cm map of GRS 1758−258 and its surrounding cocoon diffuse emission obtained by combining all VLA data sets (see Table 1). The horizontal bar in the top right corner gives the angular scale. The dashed red ellipse sketches the edges of a previously unseen, cocoon-like structure around this microquasar. The synthesized beam of 10.̋6 × 5.̋6, with position angle 6.̊7, is displayed by the bottom left ellipse. Contours shown correspond to −3, 3, 4, 5, 6, 7, 8, 9, 10, 11, 12, 14, 16, 18, 20, 22, 24, and 26 times the rms background noise of 6 μJy beam-1. Three unrelated compact radio sources also appear in this map.
Current usage metrics show cumulative count of Article Views (full-text article views including HTML views, PDF and ePub downloads, according to the available data) and Abstracts Views on Vision4Press platform.
Data correspond to usage on the plateform after 2015. The current usage metrics is available 48-96 hours after online publication and is updated daily on week days.
Initial download of the metrics may take a while.