Fig. 3
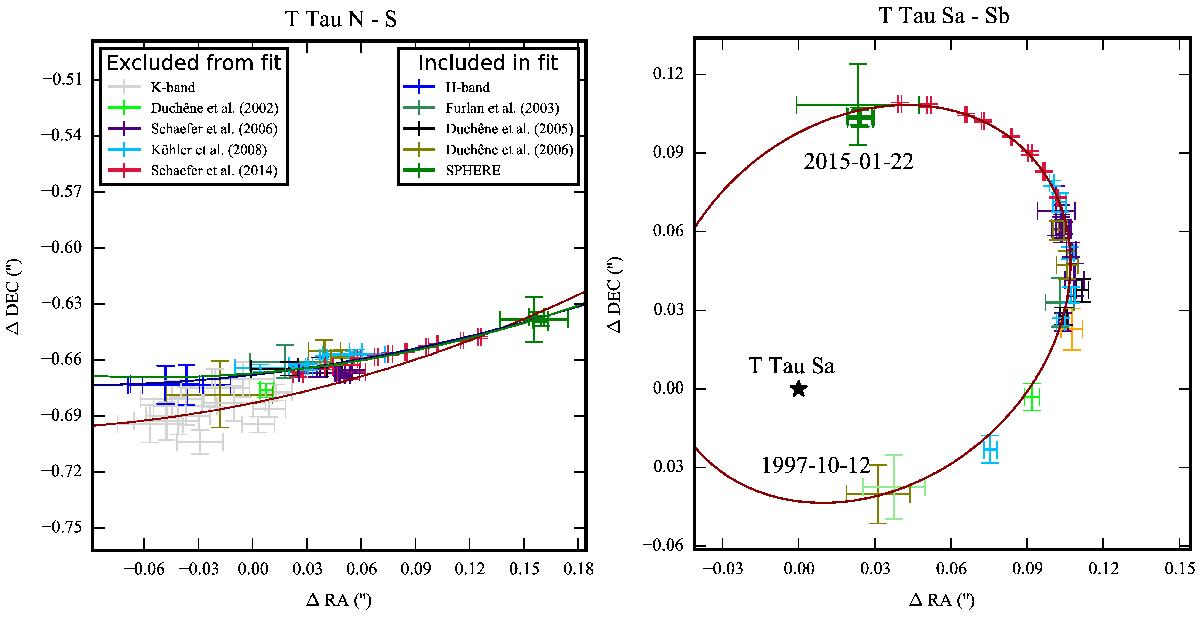
Left: epochs of T Tau S around T Tau N. The coordinates are relative to T Tau N. Observations in which the Sa/Sb pair is not resolved are shown in either light grey or blue. The coloured markers show the resolved observations, in which the centre of mass was calculated from the position of Sa and Sb. The red line shows the orbit calculated by Köhler et al. (2008). The dark blue and green lines shows two possible orbital fits with the extreme periods of 2.7 × 10⁴ and 475 years, respectively. Right: epochs of T Tau Sb around T Tau Sa. The coordinates are relative to T Tau Sa. The red line shows the orbit calculated by Schaefer et al. (2014).
Current usage metrics show cumulative count of Article Views (full-text article views including HTML views, PDF and ePub downloads, according to the available data) and Abstracts Views on Vision4Press platform.
Data correspond to usage on the plateform after 2015. The current usage metrics is available 48-96 hours after online publication and is updated daily on week days.
Initial download of the metrics may take a while.