Free Access
Fig. 3
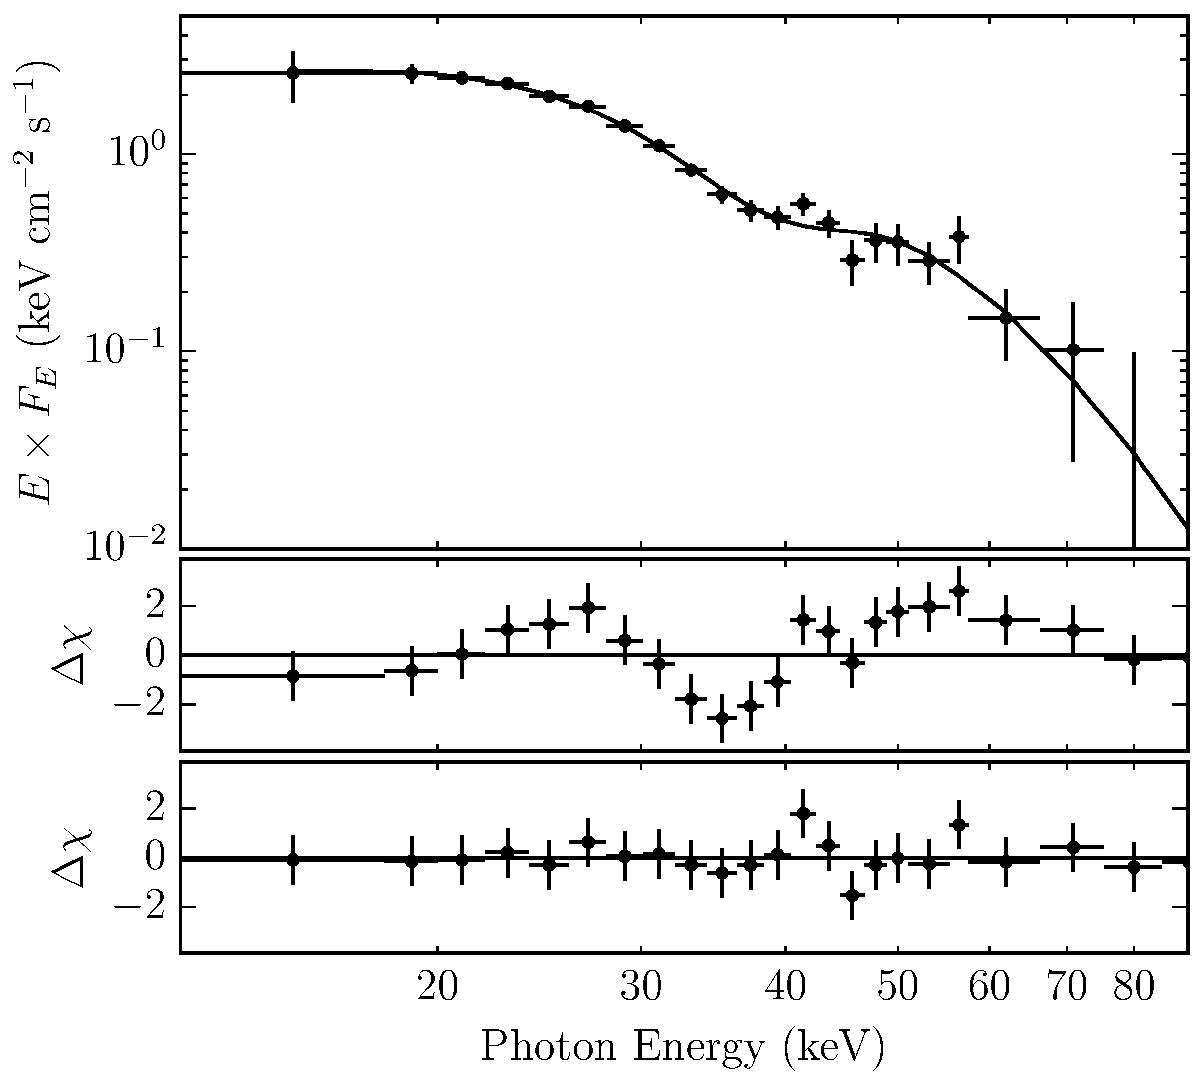
Example of a Swift/BAT spectrum of Her X-1 accumulated during an observation of about15 ks fitted with a power-law-cutoff model with a Gaussian absorption line representing the CRSF (top) and the residuals after fitting the spectrum without the Gaussian line (middle) and including the line (bottom).
Current usage metrics show cumulative count of Article Views (full-text article views including HTML views, PDF and ePub downloads, according to the available data) and Abstracts Views on Vision4Press platform.
Data correspond to usage on the plateform after 2015. The current usage metrics is available 48-96 hours after online publication and is updated daily on week days.
Initial download of the metrics may take a while.