Fig. 1
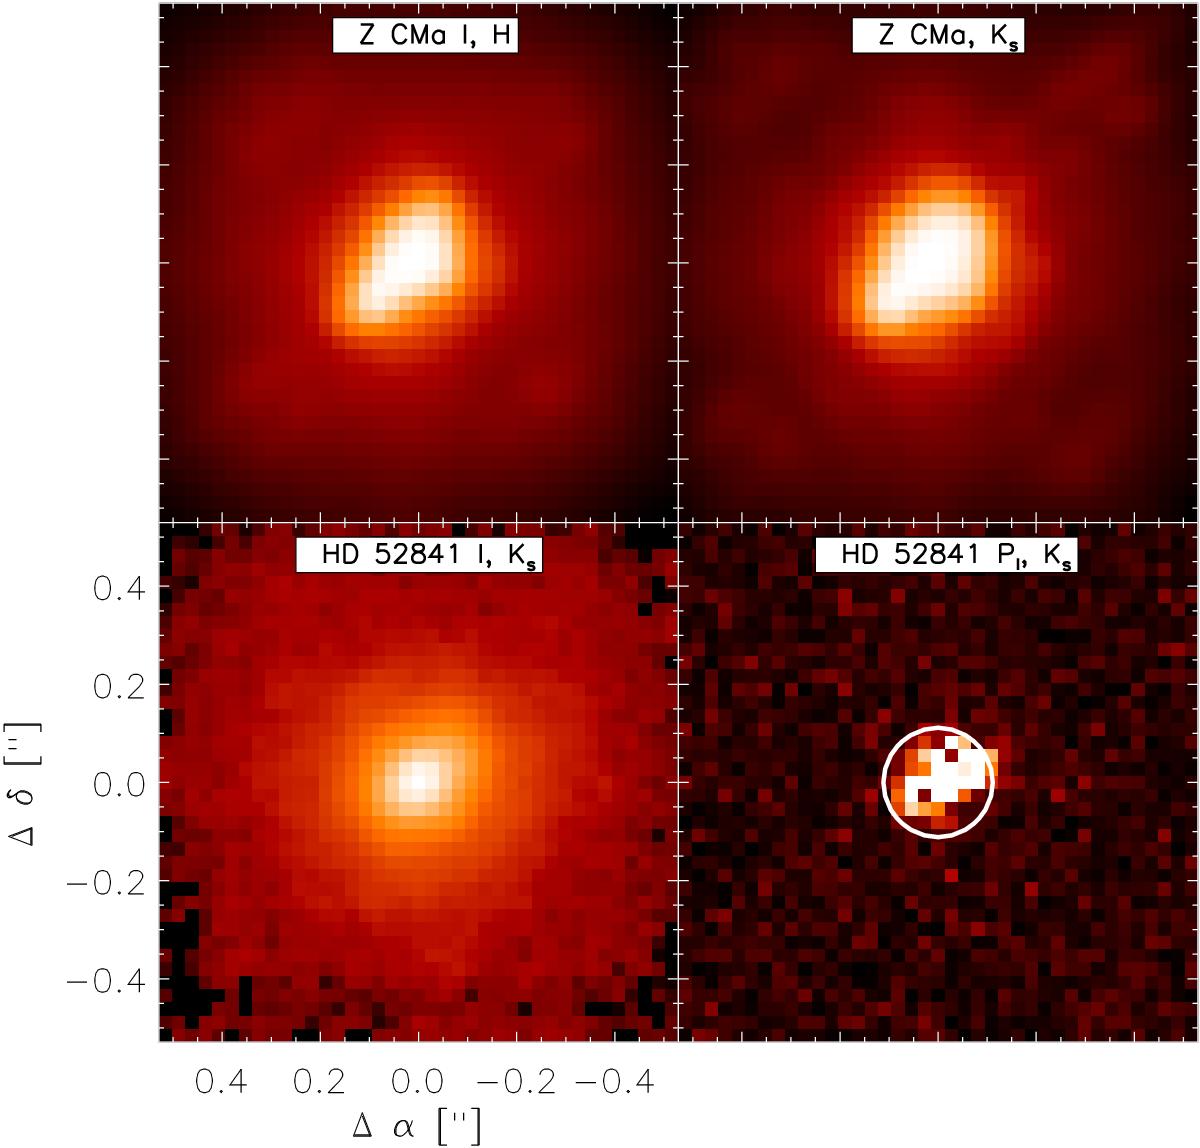
Top-left and bottom-left: intensity images in logarithmic scale. AO artifacts are visible in the Z CMa images. HD 52841 is slightly elongated in the SE-NW direction. Bottom-right: the PI image of HD 52841 shows the noise that inevitably appears in the innermost ![]() of the image (indicated by the white circle) as a result of imperfect speckle suppression.
of the image (indicated by the white circle) as a result of imperfect speckle suppression.
Current usage metrics show cumulative count of Article Views (full-text article views including HTML views, PDF and ePub downloads, according to the available data) and Abstracts Views on Vision4Press platform.
Data correspond to usage on the plateform after 2015. The current usage metrics is available 48-96 hours after online publication and is updated daily on week days.
Initial download of the metrics may take a while.