Free Access
Fig. 6
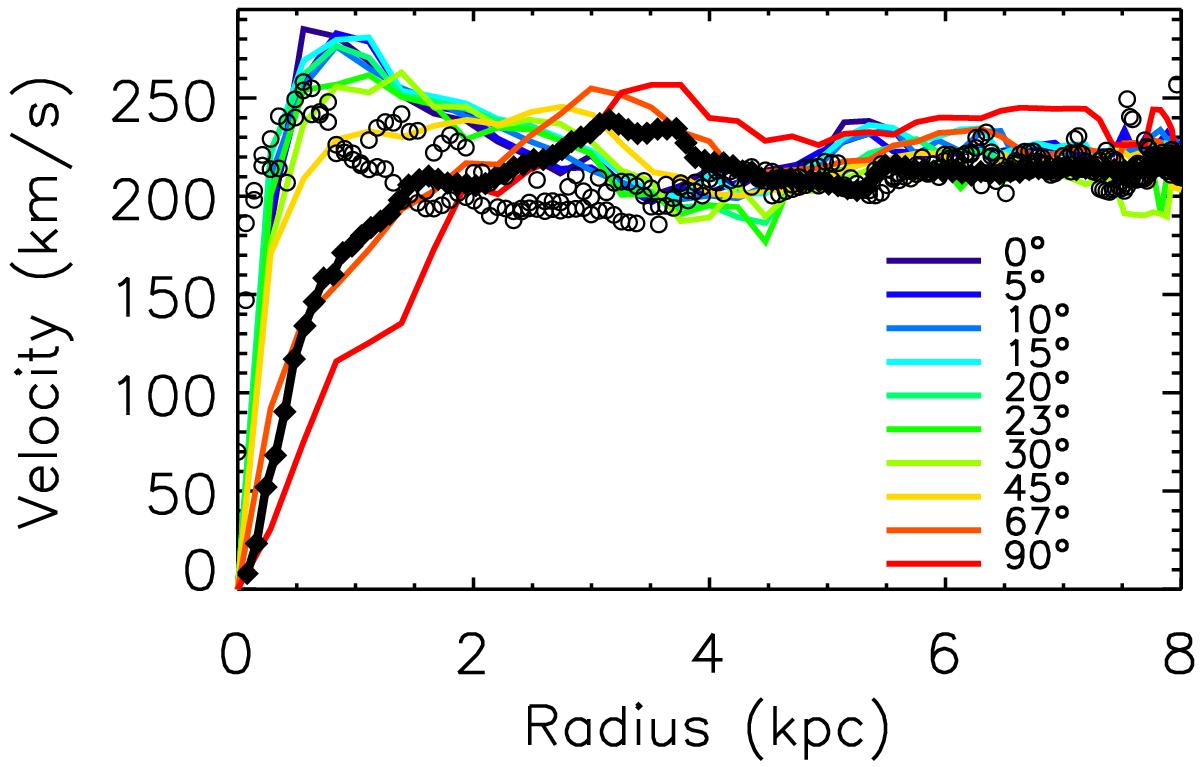
Comparison of the true rotation curve of the simulated disk (filled symbols) with the velocity profiles inferred by the tangent-point method (colored lines). The viewing angle of the bar is indicated for each velocity profile. The open circles represent the velocities from the Hi observations of the Milky Way.
Current usage metrics show cumulative count of Article Views (full-text article views including HTML views, PDF and ePub downloads, according to the available data) and Abstracts Views on Vision4Press platform.
Data correspond to usage on the plateform after 2015. The current usage metrics is available 48-96 hours after online publication and is updated daily on week days.
Initial download of the metrics may take a while.