Fig. 4
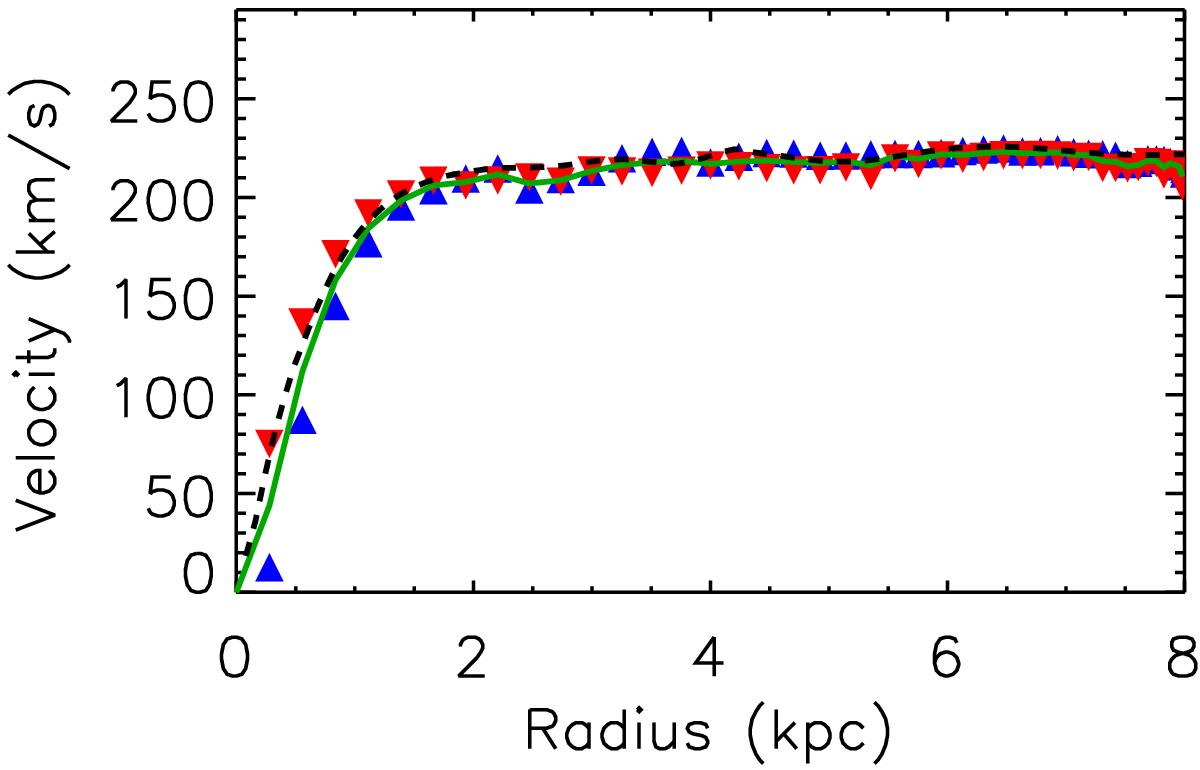
Rotation velocity profile of the simulated disk inferred by the tangent-point method for the axisymmetric disk (before the formation of the bar and spiral arms). Colored symbols are the same as in Fig. 3. The solid line is the average curve from the two halves. The dashed line is the true rotation curve of the simulated disk.
Current usage metrics show cumulative count of Article Views (full-text article views including HTML views, PDF and ePub downloads, according to the available data) and Abstracts Views on Vision4Press platform.
Data correspond to usage on the plateform after 2015. The current usage metrics is available 48-96 hours after online publication and is updated daily on week days.
Initial download of the metrics may take a while.