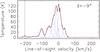
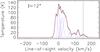
Fig. 2

Examples of spectral decomposition of the Hi profiles at l = −9° and l = 12°. The solid black curve shows the observed profile, which is decomposed using multiple Gaussian functions (in blue). The reconstructed profile is shown as a dashed red curve. The vertical dashed line shows the terminal velocity of the peak selected to derive the rotational velocity with Eq. (2).
Current usage metrics show cumulative count of Article Views (full-text article views including HTML views, PDF and ePub downloads, according to the available data) and Abstracts Views on Vision4Press platform.
Data correspond to usage on the plateform after 2015. The current usage metrics is available 48-96 hours after online publication and is updated daily on week days.
Initial download of the metrics may take a while.