Fig. 2
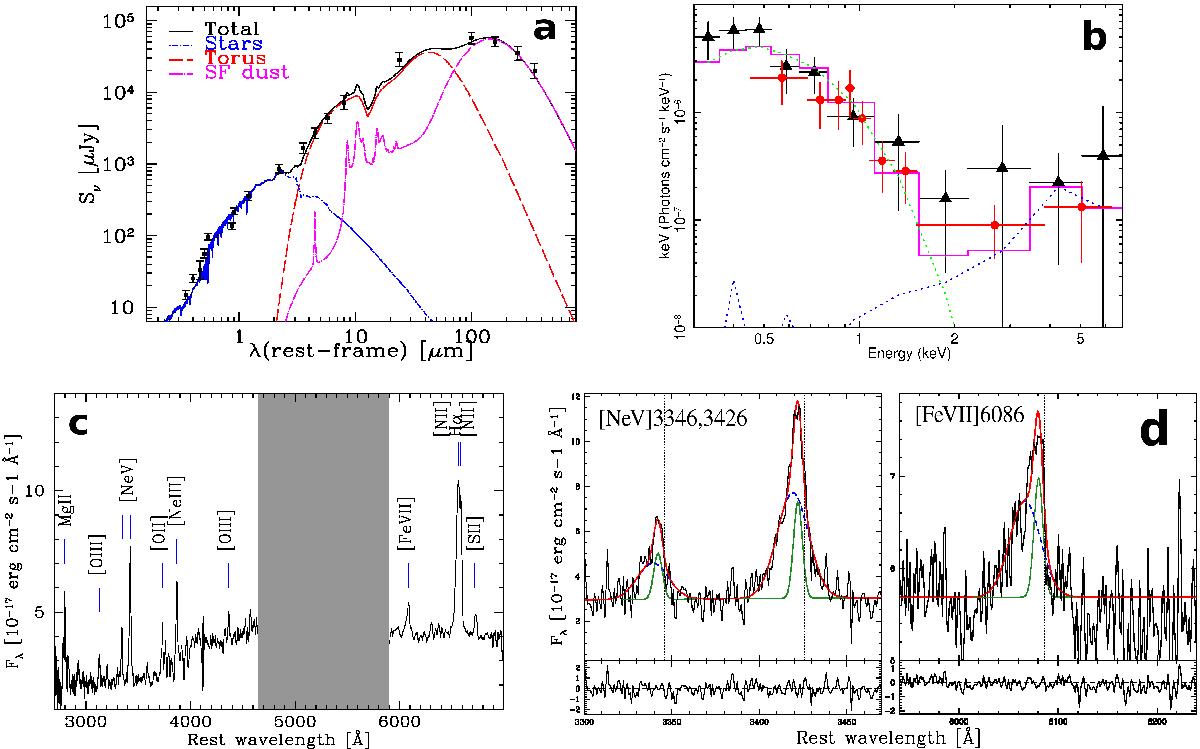
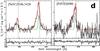
a) Rest frame, broad-band SED of XID-392. In blue we show the stellar emission, in red the AGN torus emission, and in magenta the SF dust emission. b) Unfolded XMM-Newton (black) and Chandra (red) spectra of XID-392. The best-fit model (magenta) is composed of a thermal component (green) and an obscured torus template (blue). c) SDSS optical spectrum of XID-392. The most prominent emission lines are labelled. The grey area masks a region of bad-sky subtraction. d) [NeV]3346,3426 and [FeVII]6086 lines decomposition. The green curve represents the narrow component, while the blue curve represents the broadened asymmetric component, associated with the outflow. The red curve is the sum of the two components. The dotted lines represent the systemic redshift, estimated from the continuum and the stellar absorption lines.
Current usage metrics show cumulative count of Article Views (full-text article views including HTML views, PDF and ePub downloads, according to the available data) and Abstracts Views on Vision4Press platform.
Data correspond to usage on the plateform after 2015. The current usage metrics is available 48-96 hours after online publication and is updated daily on week days.
Initial download of the metrics may take a while.