Fig. 1
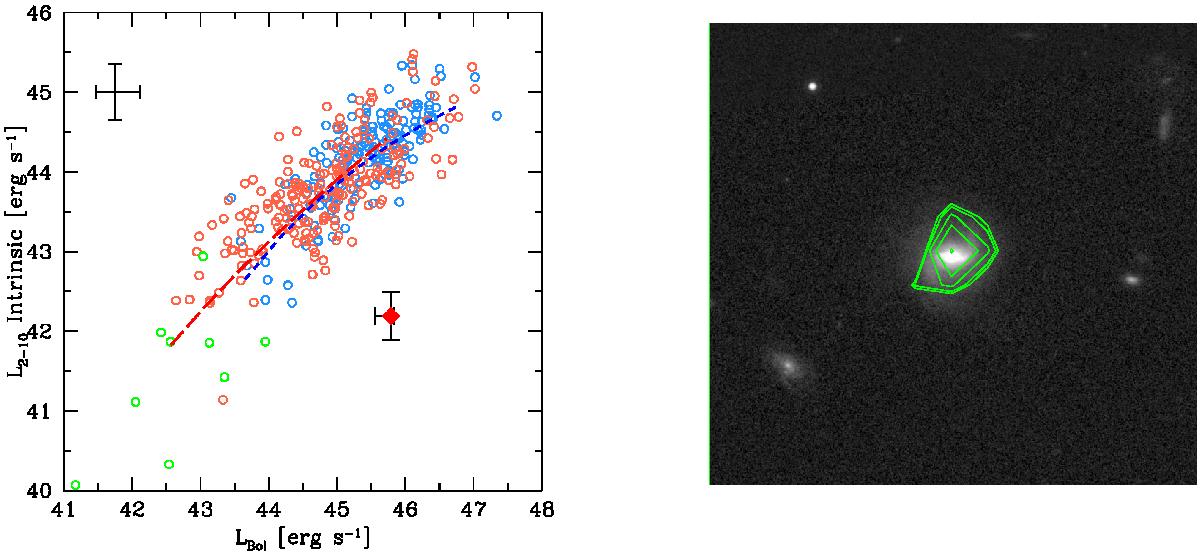
Left: intrinsic L2−10, corrected for absorption is plotted against the bolometric luminosity derived from the SED fitting. Orange (cyan) circles represent type 2 (type 1) AGN, while green circles represent galaxies. The average error is shown in the upper left corner. Source XID-392 is shown with a red diamond and relative error bars. The relation derived for type 2 (type 1) AGN in L12 is shown with the red (blue) dashed line. Right: HST-ACS I band 20 × 20″ image of the source. The X-ray contours from the Chandra full-band (0.5−7 keV) image are superimposed in green.
Current usage metrics show cumulative count of Article Views (full-text article views including HTML views, PDF and ePub downloads, according to the available data) and Abstracts Views on Vision4Press platform.
Data correspond to usage on the plateform after 2015. The current usage metrics is available 48-96 hours after online publication and is updated daily on week days.
Initial download of the metrics may take a while.