Free Access
Fig. 2
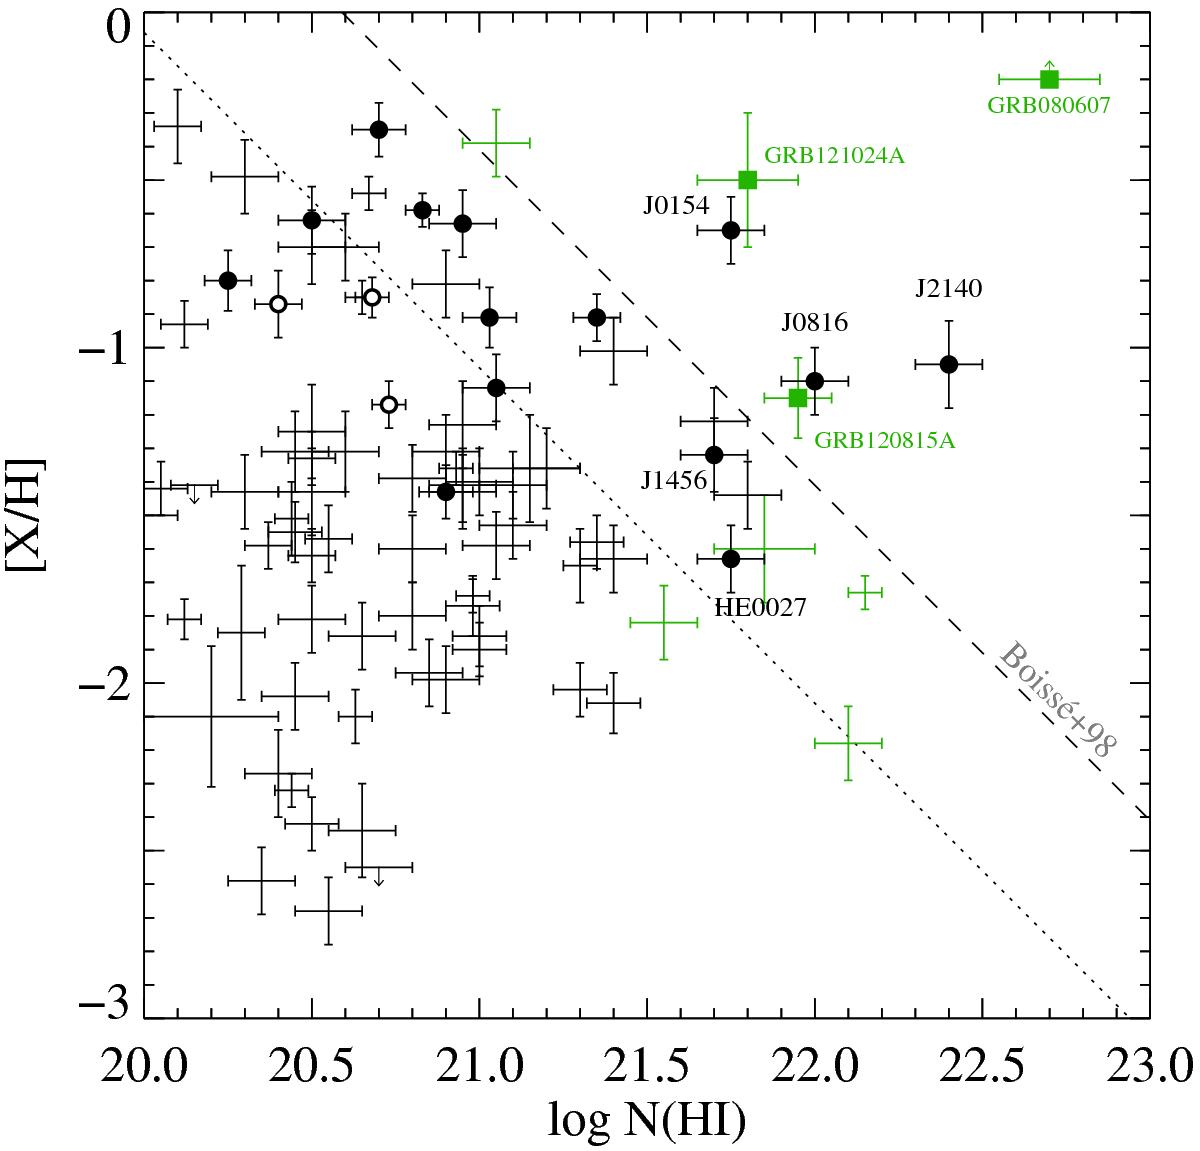
Metallicity versus H i column density. Data samples and corresponding symbols are as in Fig. 2. Filled (resp. unfilled) circles represent systems in which H2 has been detected with log N(H2) ≥ 17 (resp. log N(H2) < 17). The dotted (resp. dashed) line represents a constant log N(Zn ii) = 12.5 (resp. log N(Zn ii) = 13.15).
Current usage metrics show cumulative count of Article Views (full-text article views including HTML views, PDF and ePub downloads, according to the available data) and Abstracts Views on Vision4Press platform.
Data correspond to usage on the plateform after 2015. The current usage metrics is available 48-96 hours after online publication and is updated daily on week days.
Initial download of the metrics may take a while.