Fig. 1
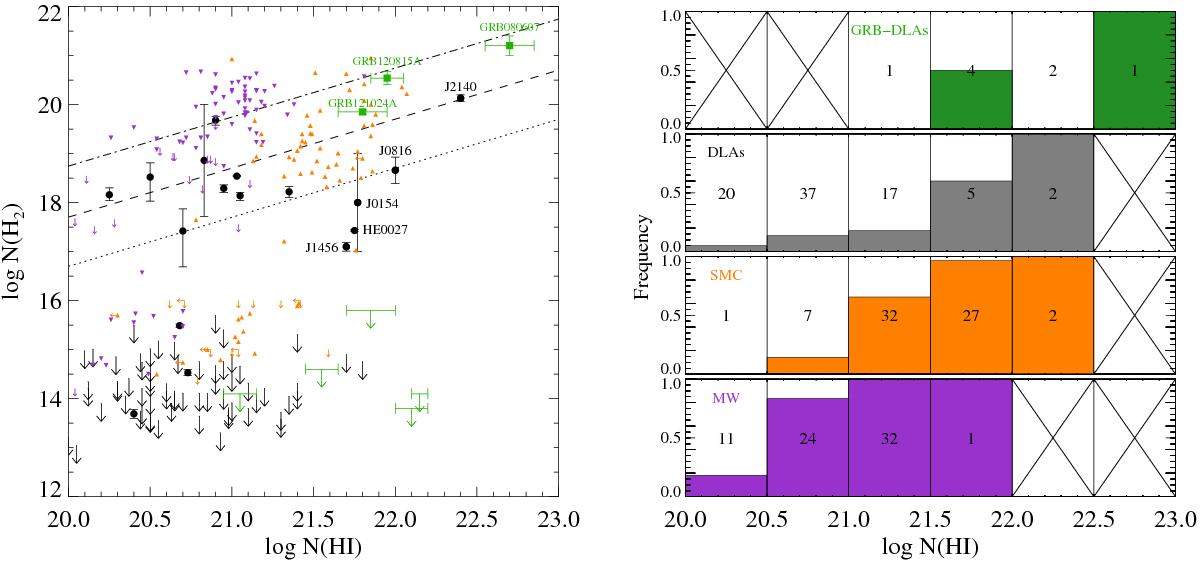
Left: column density of H2 as a function of that of H i. Data for high-redshift (z> 1.8) quasar-DLAs (black points and arrows) are from Noterdaeme et al. (2008; updated to more recent determination in a few cases, Ivanchik et al. 2010; Rahmani et al. 2013; Albornoz Vásquez et al. 2014). Additional measurements in ESDLAs are from Noterdaeme et al. (2015) and Guimarães et al. (2012). Data for GRB-DLAs (green) are from Ledoux et al. (2009, upper limits), Prochaska et al. (2009, GRB 080607), Krühler et al. (2013, GRB 120815A), and Friis et al. (2015, GRB 121024A). With the exception of GRB 080607 and GRB 121024A, in which damped H2 lines allow for accurate column density measurement at medium spectral resolution, all high-z values (quasar and GRB DLAs) are from UVES data. Purple (resp. orange) points represent measurements in the Milky Way (resp. SMC). The dotted, dashed, and dash-dotted lines represent average molecular fractions of, respectively, f = 0.1, 1, and 10%. Right: frequency of H2 detection as a function of the H i column density. For each N(H i) bin, systems with log N(H2) ≥ 17 are coded in colour, and systems with log N(H2) < 17 are shown in white. Systems with upper limits that are not stringent (i.e. above log N(H2) = 17) are not taken into account. The numbers in each box indicate the total number of systems contributing to the bin. Crossed boxes have no statistics.
Current usage metrics show cumulative count of Article Views (full-text article views including HTML views, PDF and ePub downloads, according to the available data) and Abstracts Views on Vision4Press platform.
Data correspond to usage on the plateform after 2015. The current usage metrics is available 48-96 hours after online publication and is updated daily on week days.
Initial download of the metrics may take a while.