Free Access
Fig. 6
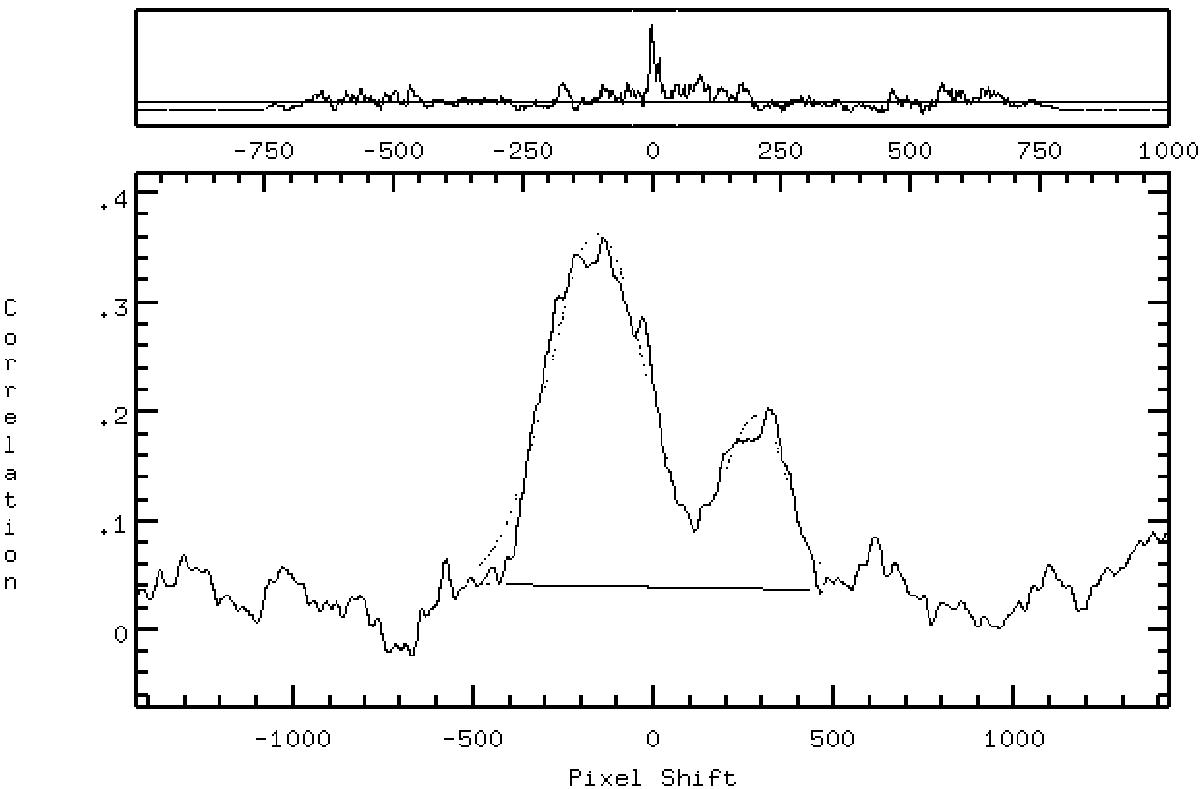
Cross-correlation plot for J093010B at phase 0.24, exhibiting two strong peaks corresponding to the binary components (primary on the left, secondary on the right). The two broadest calcium lines at 8542 and 8662 Å were excluded from the cross-correlation to minimize the uncertainty in the radial velocity measurements.
Current usage metrics show cumulative count of Article Views (full-text article views including HTML views, PDF and ePub downloads, according to the available data) and Abstracts Views on Vision4Press platform.
Data correspond to usage on the plateform after 2015. The current usage metrics is available 48-96 hours after online publication and is updated daily on week days.
Initial download of the metrics may take a while.