Fig. 4
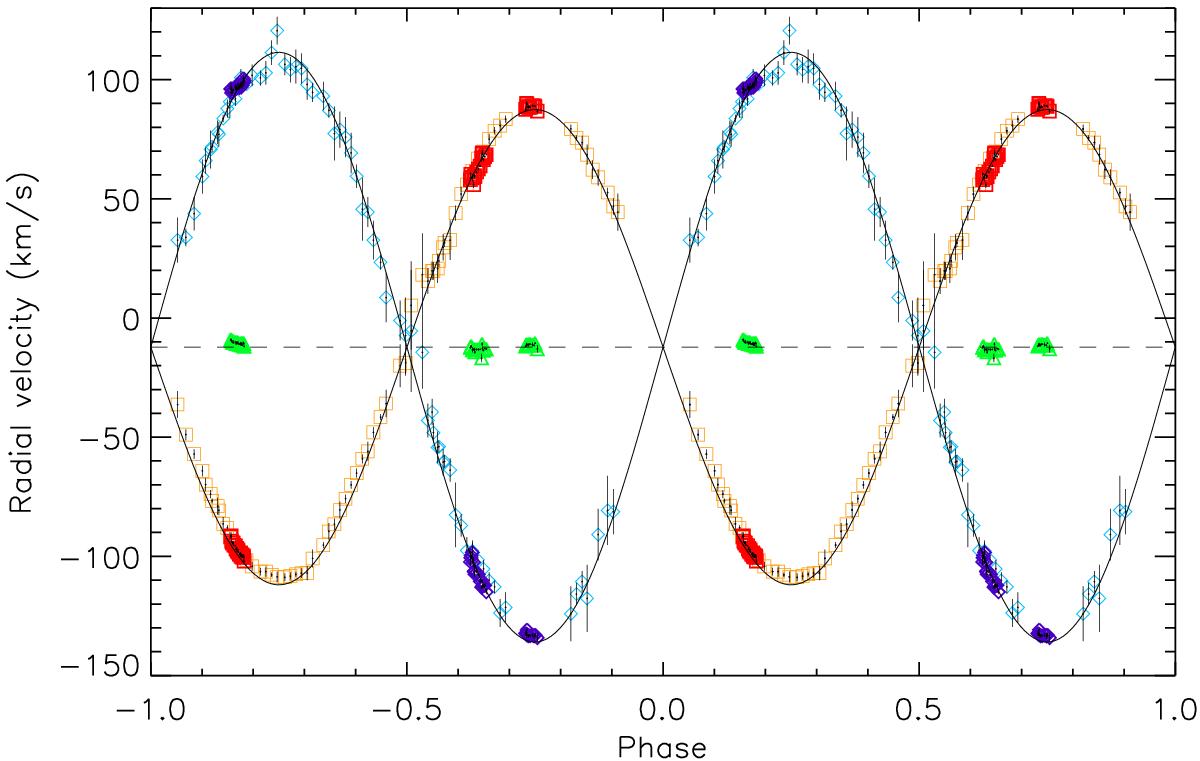
Radial velocity curves for J093010A. The primary’s measurements are indicated by squares, the secondary by diamonds and the third component by triangles. Data from Koo et al. (2014) is in fainter print (orange and light blue in the online version of the paper) and our new results are in bold print (red, dark blue and green). Phase-folding uses Koo et al.’s primary minimum time of HJD 2 456 346.78443 and our optimum period. PHOEBE model fits are overplotted (solid black curves) and the location of the modelled system velocity is shown by the dashed line.
Current usage metrics show cumulative count of Article Views (full-text article views including HTML views, PDF and ePub downloads, according to the available data) and Abstracts Views on Vision4Press platform.
Data correspond to usage on the plateform after 2015. The current usage metrics is available 48-96 hours after online publication and is updated daily on week days.
Initial download of the metrics may take a while.