Fig. 15
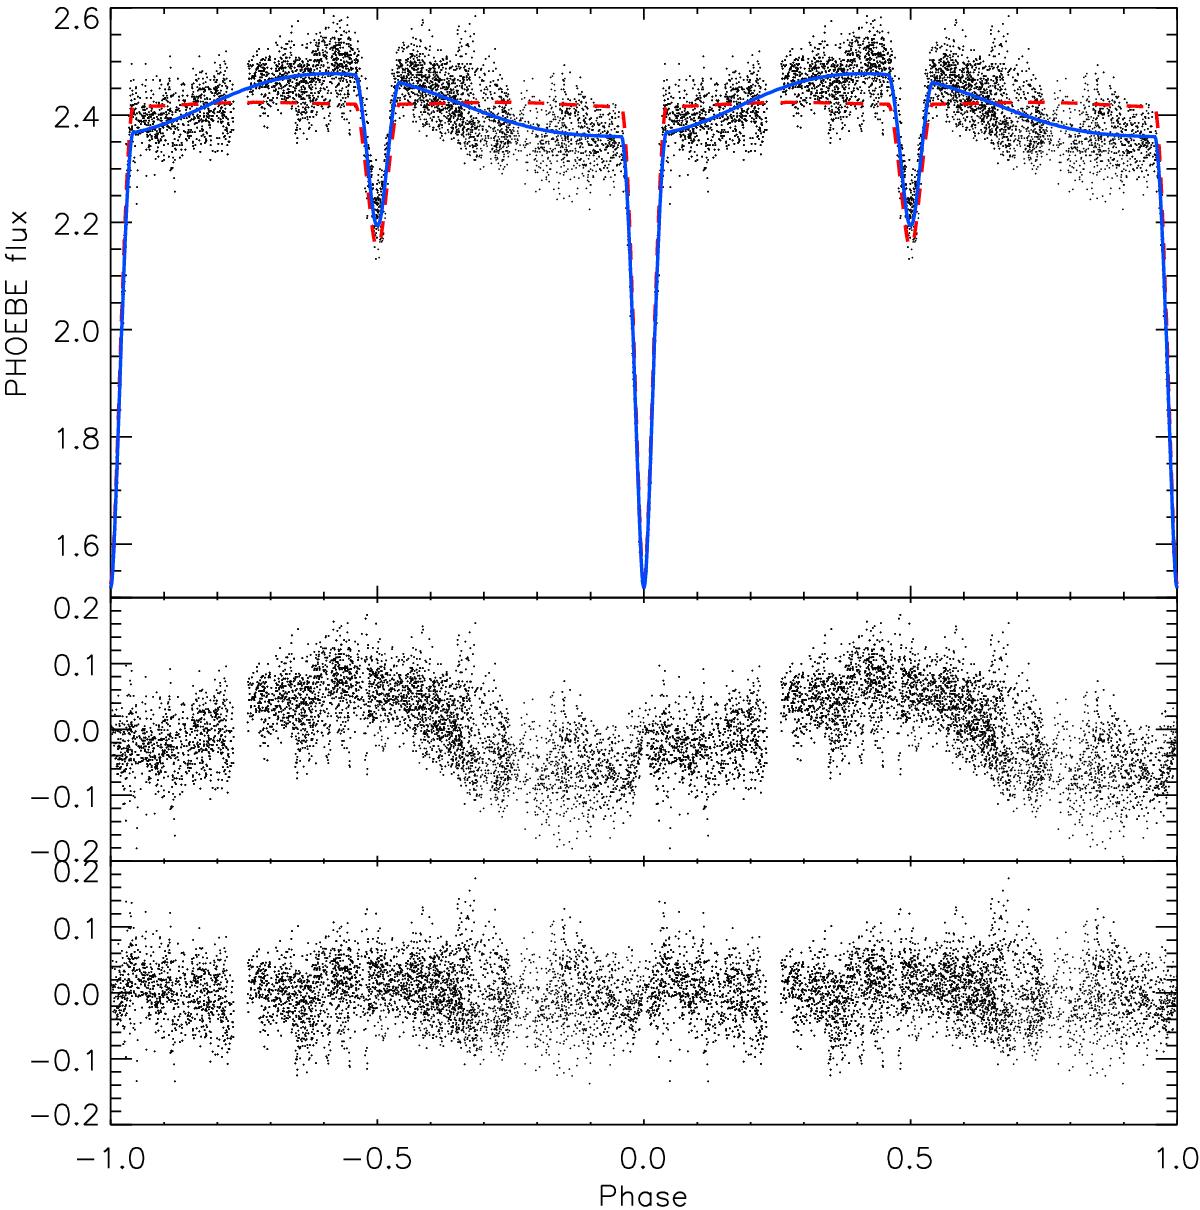
Top: V band light curves for J093010A (data from Koo et al. 2014) expressed in PHOEBE flux units, with best-fitting PHOEBE model curves overplotted (dashed red lines indicate model with no spot, solid blue lines indicate one-spot example model). Middle: residuals from no-spot model, showing out-of-eclipse semi-sinusoidal light variation unaccounted for. Bottom: residuals from one-spot model, largely correcting for these variations.
Current usage metrics show cumulative count of Article Views (full-text article views including HTML views, PDF and ePub downloads, according to the available data) and Abstracts Views on Vision4Press platform.
Data correspond to usage on the plateform after 2015. The current usage metrics is available 48-96 hours after online publication and is updated daily on week days.
Initial download of the metrics may take a while.