Free Access
Fig. 1
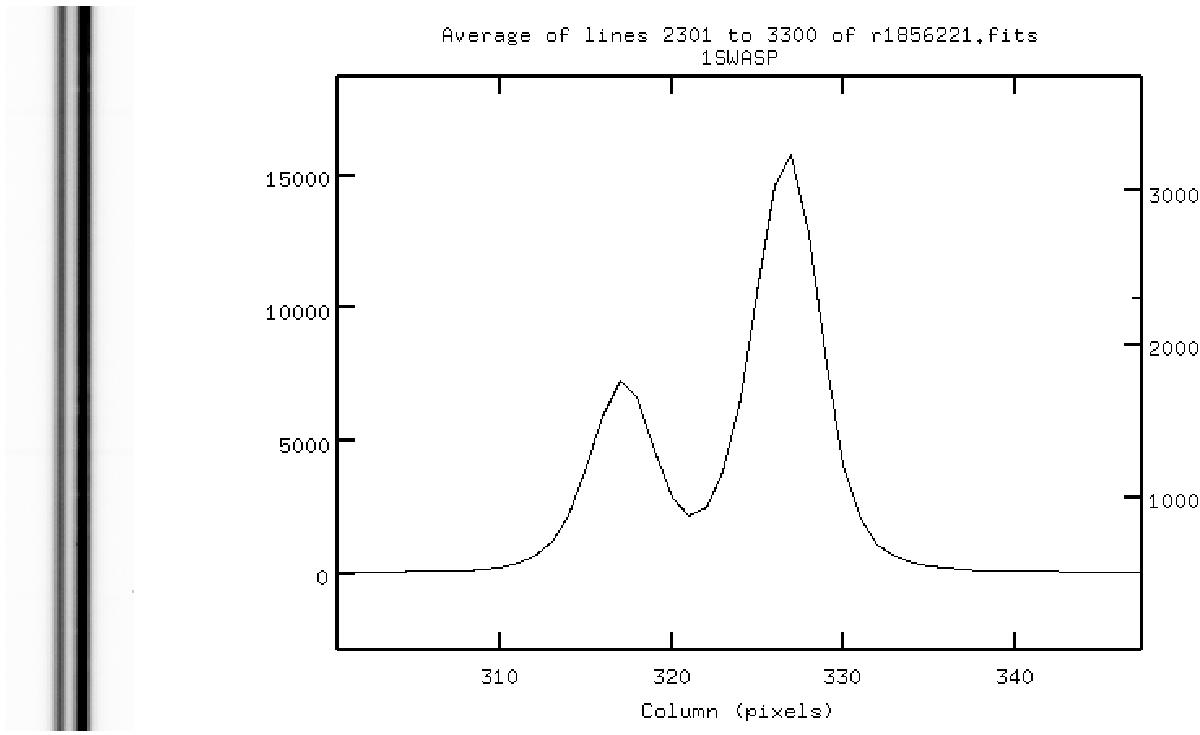
Left: section of spectra for J093010A and J093010B from a single 360 s exposure, showing spatial separation. Right: plot of spectral profile from same exposure, cut perpendicular to the dispersion axis, showing two clear peaks in the line dispersion function. The stronger peak on the right hand side corresponds to J093010A.
This figure is made of several images, please see below:
Current usage metrics show cumulative count of Article Views (full-text article views including HTML views, PDF and ePub downloads, according to the available data) and Abstracts Views on Vision4Press platform.
Data correspond to usage on the plateform after 2015. The current usage metrics is available 48-96 hours after online publication and is updated daily on week days.
Initial download of the metrics may take a while.