Free Access
Fig. 7
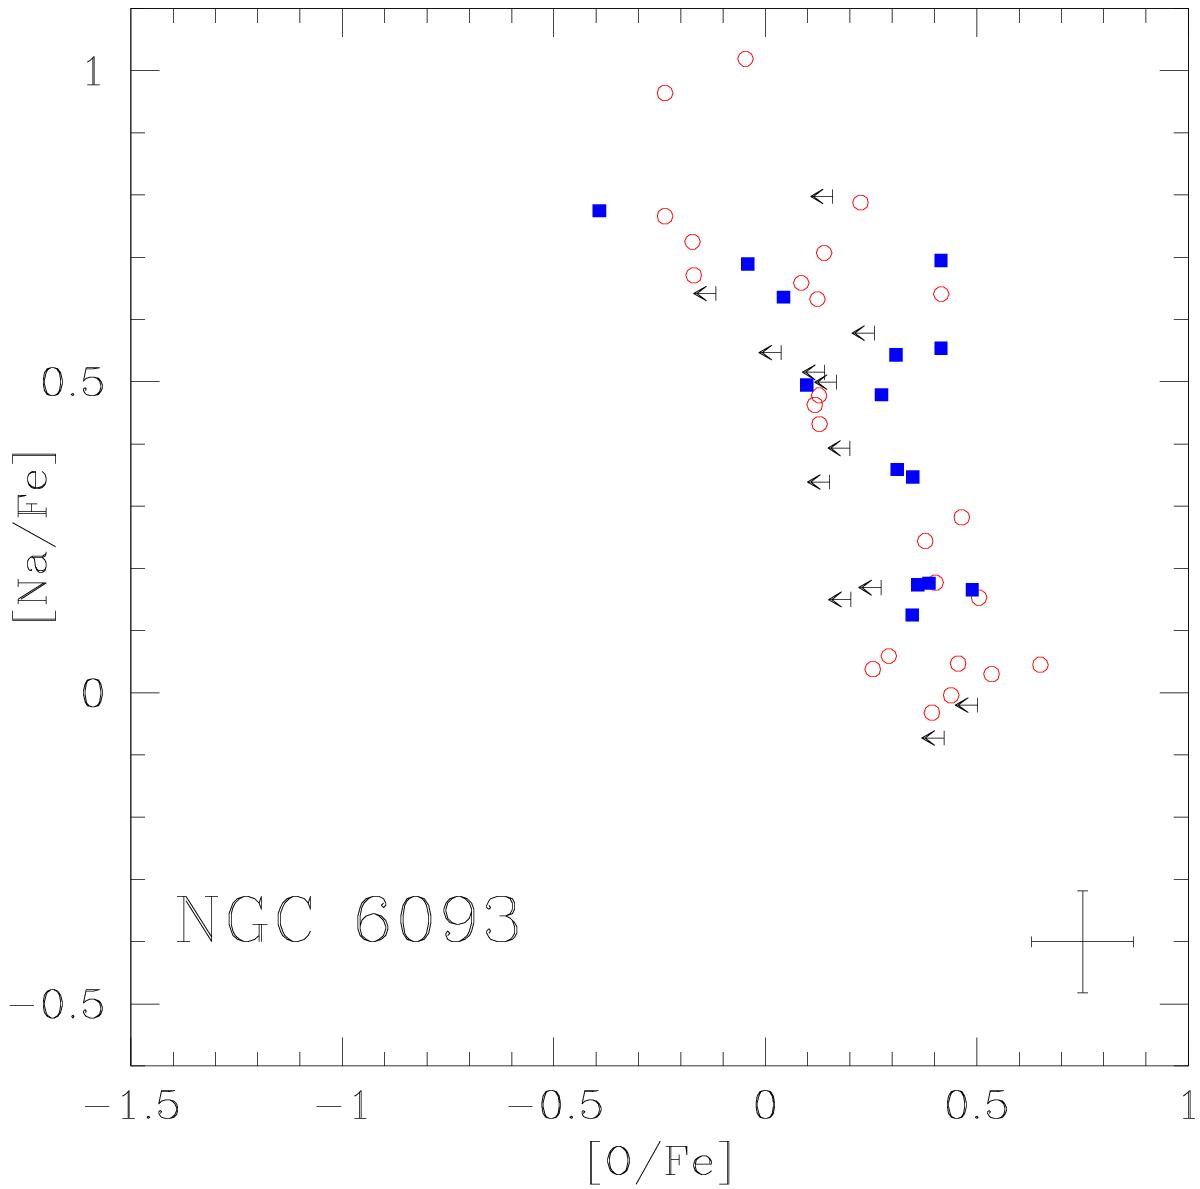
Anti-correlation between Na and O abundances in M 80. Empty circles indicate stars observed with GIRAFFE, filled squares with UVES. Upper limits in O are indicated with arrows. The error bars represent internal errors (see Appendix A).
Current usage metrics show cumulative count of Article Views (full-text article views including HTML views, PDF and ePub downloads, according to the available data) and Abstracts Views on Vision4Press platform.
Data correspond to usage on the plateform after 2015. The current usage metrics is available 48-96 hours after online publication and is updated daily on week days.
Initial download of the metrics may take a while.