Fig. 5
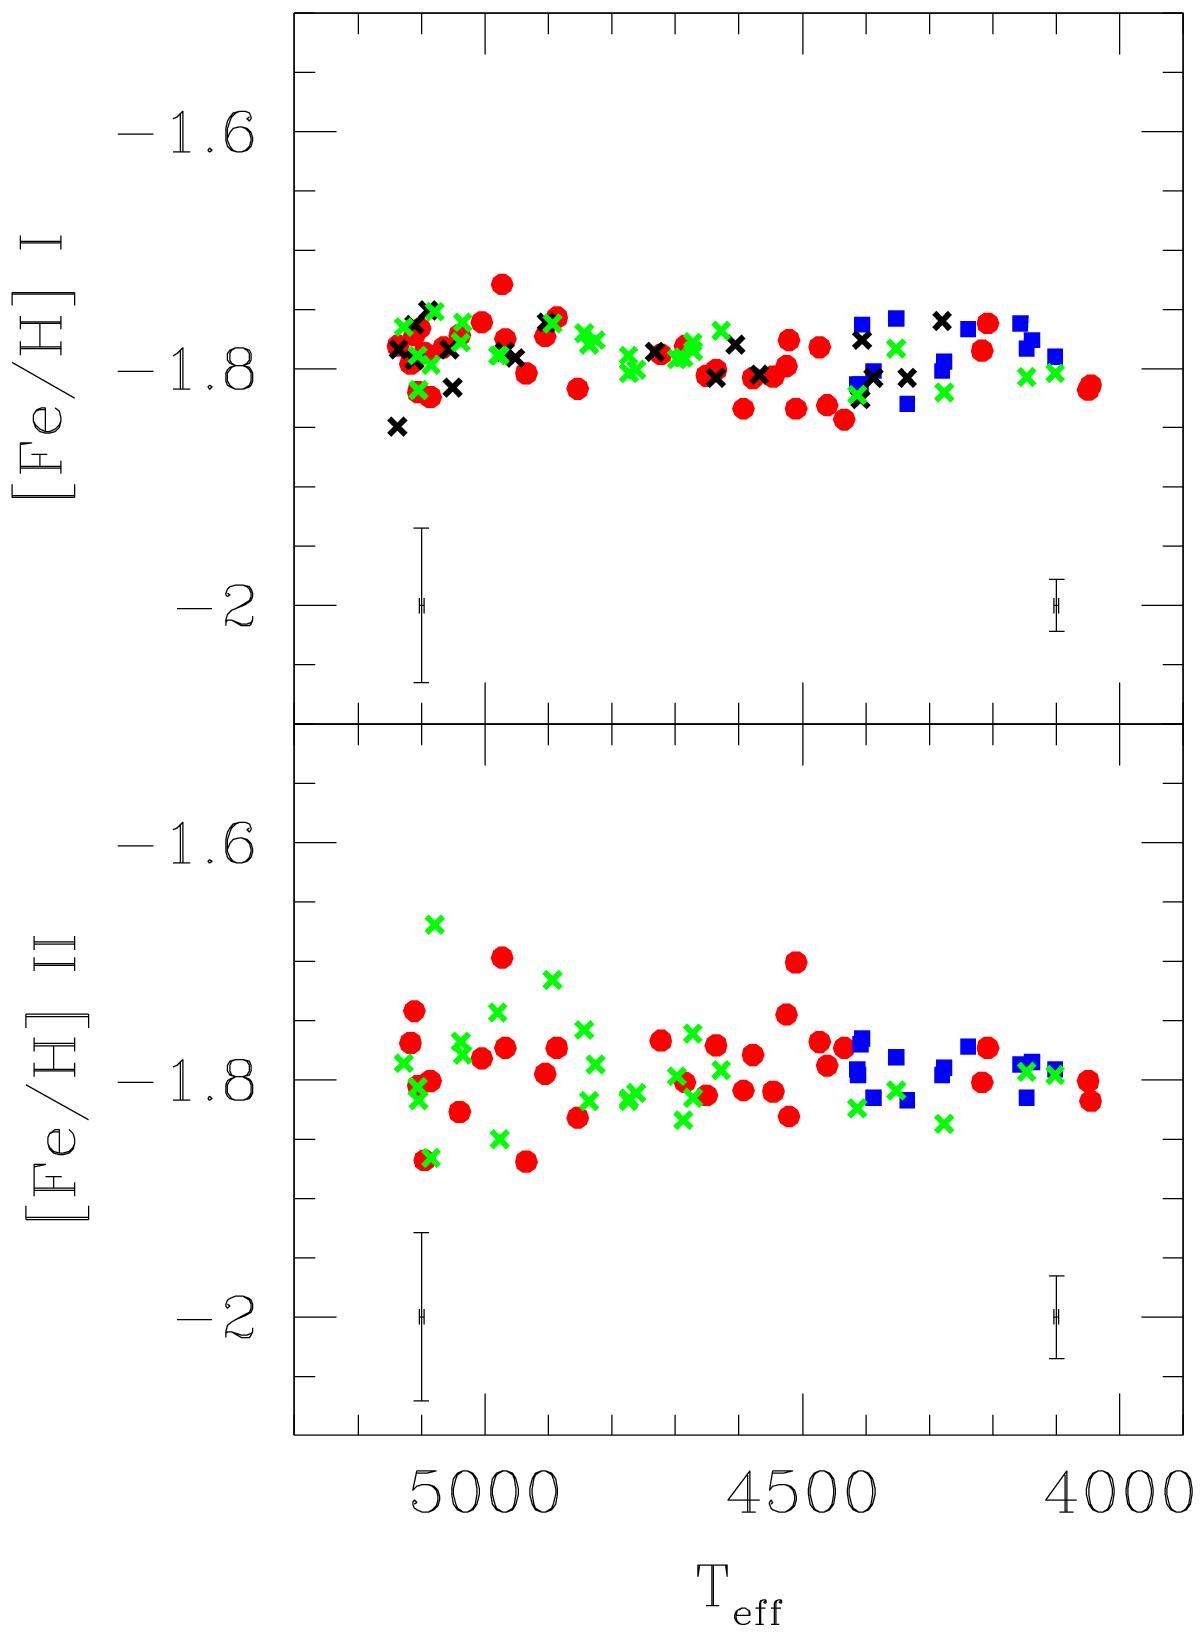
Abundance ratios [Fe/H] i (upper panel) and [Fe/H] ii (lower panel) as a function of Teff for all member stars analysed in M 80 with UVES (blue squares) and GIRAFFE spectra (red circles: setups HR11 and HR13; black crosses: HR11 only; green crosses: HR13 only). Error bars on the right and left side are star-to-star errors for targets observed with UVES and GIRAFFE, respectively.
Current usage metrics show cumulative count of Article Views (full-text article views including HTML views, PDF and ePub downloads, according to the available data) and Abstracts Views on Vision4Press platform.
Data correspond to usage on the plateform after 2015. The current usage metrics is available 48-96 hours after online publication and is updated daily on week days.
Initial download of the metrics may take a while.